Changing Coastlines
This document presents information about the scales, both geographic and temporal, over which change can occur in the coastal zone. The student activity found at the end of this document uses maps and animations to determine how much change is occurring at a particular site and how fast it is happening.
General Background on Florida's Changing Coastline
The coastal zone is an area that is under intense human development and utilization. It is also one in which significant geologic change occurs at a rapid pace (on human timescales). The very dynamic nature of the coastal zone juxtaposed on the intense societal pressure to develop these areas creates an important need to understand coastal systems.
Why is the coastline so dynamic and rapidly changing? Change in a system is driven by a flow of energy (and/or matter) within and through the system. The coastal system is an environment where a tremendous amount of energy is transferred to the land from the ocean. Most of us are more familiar with thinking about power (measured in watts) than energy (measured in joules). Power is just a measurement of the rate at which energy is transferred (1 watt of power equals 1 joule of energy per second). A 3-meter-tall surface wave transmits about 100 megawatts (100 X 106 watts) of power for every kilometer length of the wave. That is roughly the equivalent to the power generated by a large power plant. Although the number can be difficult to calculate, researchers have estimated that globally the total power flux from the oceans to the coastline is on the order of 5.5 x 10⁹ kilowatts. That is the equivalent of 55,000 100-megawatt power plants!
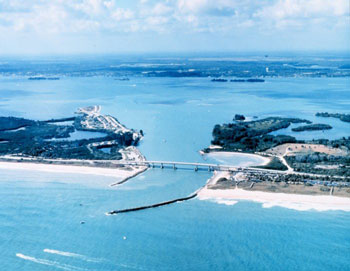
Figure 1. Sebastian Inlet, along Florida’s east coast. Photo credit: National Oceanic and Atmospheric Administration/Department of Commerce
Much of the Florida coastline is flanked by barrier islands. Barrier islands are long, narrow ridges of sand (or other sediments) that parallel the coastline and are separated from the mainland by lagoon or other body of water. In the United States, much of the Atlantic and Gulf of Mexico coasts have barrier island systems. The outer banks of North Carolina are an excellent example. The image below (Figure 1) shows barrier islands on Florida’s Atlantic coast in the region of Sebastian Inlet. The Florida mainland can be seen in the background of this image.
The US barrier island system is, geologically speaking, a young geologic feature. These barrier islands formed in response to a specific series of geologic events triggered by the end of the last ice age, which peaked about 18,000 years ago. Retreating (melting) glaciers delivered vast amounts of sediment to the coastline via meltwater rivers. These sediments were redistributed along the coastline forming coastal ridges (dune fields). As the glaciers melted sea level rose. Sea level is now about 120 meters higher than it was 18,000 years ago at the peak of the last ice age. Eventually, rising sea level flooded the region behind these beach ridges, effectively turning them into islands. Because these barrier islands formed recently in response to a series of rapid (geologically) changes on Earth, and they are impacted by tremendous amounts of energy from the oceans they themselves are susceptible to rapid change. Much information regarding the nature and origin of US barrier island systems is available on the internet. A few references for useful websites are found at the end of this document.
What controls the character of a beach?
Ultimately, the character of any coastline is controlled by the amount of energy that the coast receives, the distribution of that energy, the sediment budget (inputs and outputs of sediment to the coastline), and the nature of the rocks and geology of the coast (some geologic materials are more easily eroded than others, for example). One example of how the energy profile of a coastline affects its characteristics can be seen in seasonal changes to the beach profile that occur because of cyclic seasonal changes in energy transfer to the coast. Over shorter timescales, the impacts of tropical cyclones can completely destroy a barrier island in a single event, redistributing the sediment elsewhere. In this student investigation, students use historical maps and animations to investigate change that has occurred to Anastasia Island, a barrier island along Florida’s northeast coast, over timescales of decades to centuries. Specifically, students look at changes (both natural and human induced) that have occurred to the position of the island and its inlets (waterways between islands). It is important to recognize that even this "longer" term change is still very rapid in terms of both geologic and human timeframes. With home mortgage terms of 30 years, decadal scale change becomes very significant (though your students may think that change that occurs over a span of 30 or 40 years may not be of particular concern).
In the case of this example (and generally speaking), two important factors that are driving the observed changes in the positions of the islands and inlets are (1) changes to river flow and sediment delivery to the coast, and (2) longshore transport processes (which affect how wave energy is distributed along the coastline). In sediment-rich coastlines, the redistribution of sediment by longshore transport is a major factor that affects coastlines. Accordingly, a brief primer on longshore transport is in order. Many rich online resources exist on this subject, and several web resources are detailed at the end of this document. However, perhaps one of the most useful to bookmark is the website for the Digital Library for Earth System Education (http://www.DLESE.org). This website is an expansive clearing house for online educational resources and is searchable via a number of different criteria including content area, grade level, specific standards, and resource type (classroom activity, lab activity, lecture resource, computer activity, visualization, etc.).
Longshore Transport
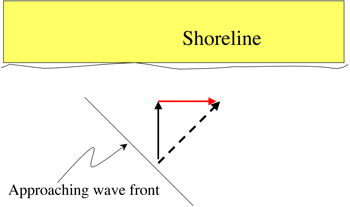
Figure 2. Schematic of wave energy vectors. The bold dashed arrow shows the motion vector of the wave, while the solid arrows show the component parts of that vector.
Longshore transport refers to the movement of water and sediments along the shore, parallel to the coast. This movement results from wave action and the resultant longshore currents that flow parallel to the coast. Longshore currents form when waves (wave fronts) approach the shoreline at an angle to the coast (in other words the waves do not arrive parallel to the coast). In this case, if one breaks the motion vector of the wave down into its constituent parts, one component of that kinetic energy vector is directed inland, while the other is oriented parallel to the coast (Figure 2). Many of your students may have experienced the effects of longshore currents without even realizing it. The scenario goes something like this: You go to the beach, set down your towel and grab a space, then head out to swim for a while. After swimming for a while you come back onto the beach, but you are no longer where you set your towel. Instead, you have to walk along the beach to get back to your spot. Why didn’t you come back out where you entered? You were moved along the beach by longshore currents.
Longshore transport results in a tremendous amount of sediment being moves along the coast. On some beaches more than 1 million tons of sand annually passes by a location on the beach. It is for this reason that beaches have been described as rivers of sand, which is not a bad analogy. In the US, longshore transport generally moves from north to south along both the Pacific and Atlantic coasts, although this can locally be different. In the case of Florida’s northeast coast, the transport is generally from north to south. It was longshore transport that redistributed the aforementioned influx of sediments that occurred at the end of the last ice age, forming the beach ridges that eventually became the east coast barrier island system. If one looks at the sand that comprises the NE Florida beaches (Crescent Beach, for example), one will find it is mostly the mineral quartz, which forms in igneous and metamorphic rocks. There are no igneous or metamorphic rocks near the surface in Florida! These sediments ultimately originate from weathering of the Appalachian Mountains and are delivered to the coast via the rivers that flow out of those mountains. Once delivered to the coast, these sediments were transported down the eastern coast until they eventually reached Florida.
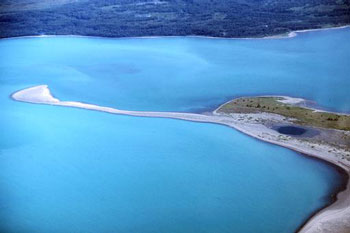
Figure 3. Point Riou spit in Ice Bay Alaska. Image Courtesy of Bruce Molnia; Copyright © Bruce Molnia, Terra Photographics; Image source: Earth Science World Image Bank http://www.earthscienceworld.org/images.
Discerning the direction of longshore transport can be done by looking at coastal landforms and sediment deposition patterns that result from that transport. In Figure 1 (above) the direction of longshore transport is from right to left (north to south in this picture). The direction of longshore transport can be discerned because transported sediment is trapped on the up-current side of the jetty that fortifies the inlet. Sediment accumulates there and the beach is wider on the up-current (right) side of the inlet. Another consequence of building this jetty (which acts to stabilize the position of inlet) is that the sediment trapped on the up-current side of the jetty robs the down-current side of incoming sediment delivered via longshore transport. The result is that erosion occurs on the down-current side (left side) of the inlet. Notice how the beach of the barrier island on the left of the inlet has retreated slightly towards the mainland compared to the right side. This is a consequence of that erosion.
The spits in Figure 3 are elongate ridges of sediment that extend out into an inlet or bay. They form from longshore transport of sediments and extend out into the bay or inlet in the direction of that transport. An animation of spit formation can be found on the DLESE web site at: http://serc.carleton.edu/NAGTWorkshops/visualization/collections/longshore.html. This animation is one of a large collection of animations available via the DLESE website.
Example Student Investigation- Anastasia Island and Florida’s Changing Coastline
Background specific to student investigation
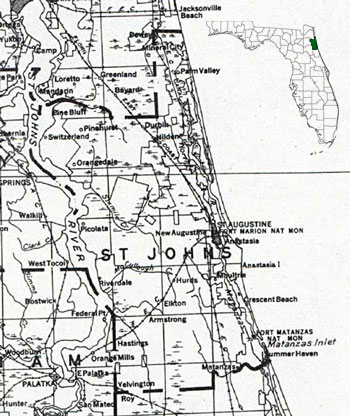
Figure 4. Location maps for St. Johns Co. Source: Florida Center for Instructional Technology, (Tampa, FL: Florida Center for Instructional Technology, 2008). Map Credits: (top) Courtesy of Roy Winkelman, (bottom) USGS, 1932. Courtesy of the Library of Congress, Geography and Map Division.
Many opportunities exist in Florida for examining coastal systems and change in the Earth system. In the student investigation provided students are engaged to both qualitatively and quantitatively assess changes that have occurred to the position of Anastasia Island and its inlets over a period of more than two centuries. This case study uses animations and static maps based on a field-trip guide prepared by Dr. Joann Mossa (University of Florida Geography Dept.) and the UF Geography Dept. staff for a course on Coastal Morphology and Processes (Mossa, 1993 and references therein). Student research at the University of Florida and interpretation of historical maps contributed to this field-trip guide and the visualizations used for this investigation. A number of images that can familiarize students with this region are available in the virtual coastal fieldtrip developed by Dr. Joann Mossa for this module.
Anastasia Island
Anastasia Island is a barrier island located in St. John’s County on the northeast coast of Florida. It is bounded to the north by St. Augustine Inlet and to the south by Matanzas Inlet, which separates it from Summer Haven Island. A reference map is provided below (Figure 4). Additionally, other maps, including Google Earth .kmz files (see below) are available for this area through the Florida Center for Instructional Technology (FCIT) website at http://fcit.usf.edu/. Historical maps of this area date back to the 1700’s, and many changes can be noted. Changes to the southern end of the island, such as the southward growth of the Anastasia Island spit and corresponding southward migration of Matanzas Inlet, have occurred as a natural consequence of longshore transport processes. Other changes (like 20th century changes to the inter-coastal waterway adjacent to Summer Haven Island) have occurred due to human influence and engineering. Particularly, the north end of the island has changed dramatically as a consequence of coastal engineering and the establishment of the St. Augustine inlet and jetty. Establishment of the modern inlet changed the flow of water to the coast and the associated distribution of sediment input to the coast. This resulted in a rapid northward growth of a spit because sediment input to the coast was shifted to the north. An animation of these changes can be viewed at the St. Augustine Lighthouse Museum website at http://www.staugustinelighthouse.com/coastline.php.
A few words about maps
This student exercise relies heavily on interpretations of maps (both animated and static). Your students may not have experience interpreting maps. If this is so, you may want to first engage your students in a review of basic map interpretation. Ideally, this should be done with a local map of an area familiar to the student. If you have access to the internet via a computer lab or a laptop projector, Google EarthTM (available for free down at http://earth.google.com/) is an excellent way to investigate maps and your area (or school, for example). Many Florida maps in the FCIT map collection (see web-link above) include Google EarthTM Google files (.kmz files) that when opened, zoom into the area of the map which is then overlaid onto the Google EarthTM image. A link to such a file for the region of Anastasia Island is found at http://fcit.usf.edu/florida/maps/pages/3800/f3855/f3855.htm.
Although there are many different kinds of maps and map projections, all maps should contain certain common elements. These include a map key (or legend) which describes the meaning of symbols, colors, etc. on the map; a directional indicator (north arrow or compass rose, for example); and a scale, often expressed as a numeric ratio and/or a reference line. Particular attention should be paid to reviewing the concept of the map scale with students. This is generally expressed as a ratio (1:24,000) or equivalence equation (1”=2000’). The ability of Google EarthTM to zoom in and out provides an excellent opportunity to help your students fully appreciate differences in map scale. Additionally, considering map scale provides opportunities for math connections regarding ratios, conversions, and simple algebraic equations.
Example Student Investigation with Key
The Florida coast is a dynamic place that is constantly changing because of the wave energy that impacts it. One big storm event can reshape the coastline over night. Seasonal changes in the width and slope of beaches occur as winter storm waves move beach sand off-shore and more gentle summer waves bring it back up on-shore. Still, on longer timescales waves and currents that flow parallel to the coast (longshore currents) continually move sand and reshape the coastline.
In this investigation you will look at some animations that show how Anastasia Island, a barrier island on the Florida northeast coast, has changed sine the mid 1700’s. After studying the animation you will use a map to determine exactly how much change is occurring and how fast it is happening.
Comment for teachers: If you did not use a map of the Anastasia Island area (see above link) students should review a map the Florida northeast coast and Anastasia Island. As mentioned above, Google Earth is an excellent tool for this purpose.
1. Spend a few minutes viewing the Animation Shoreline Changes 1765-1992: Matanazas Inlet and Surrounding Area (movie immediately left) Click the Forward button at the lower right side of the map to advance the animation.
This animation shows the changing shape of the coastline at the southern end of Anastasia Island for several different years between 1765 and 1992. To advance to the next timeframe click on the forward button in the lower right of the animation. Each later map shows a dotted outline of the map before it to help you examine the change that occurred between the two times.
2. a) Examine the coastline in 1765.
Note the position of the fort. This is Fort Matanzas. It was built in 1742. One reason it was built there was because people at the fort had a clear view through the inlet and out to sea. In all of these maps the fort is in the same place because it hasn’t moved, so it is a useful reference point to use in viewing these maps.
b) Advance the animation to 1882. The dashed outline shows what the coastline looked like in the last map (in 1765).
c) How many years have passed between the 1765 and 1882 maps? 117 years. This seems a trivial calculation by a different amount if time lapses between different successive maps in this animation so it is important that students explicitly consider how much time has passed between maps
d) In a few sentences describe at least 2 ways the islands and land surrounding the fort changed between 1765 and 1882.There are many possible answers. Of note, the shape of the island changed somewhat, but more obviously the spit that forms a peninsula to the northwest of the fort was reconfigured into an island adjacent to the island on which the fort resides.
3. Advance the animation forward to 1923. Once again, the dashed line shows the previous map (1882).
a) How has the position of Matanzas Inlet and the south end of Anastasia Island changed since the last map? It has migrated to the south as the spit that forms the southern tip of Anastasia Island has grown to the south.
Recall that the fort was built where it was because that location gave a clear view through the inlet and out to sea.
4. Advance the animation forward one frame to 1942. Note the position of the fort relative to the inlet. Remember, the fort hasn’t moved, the coastline shape has changed.
a) How many years have passed between the first map (1765) and this map (1942)? 177 years. Once again, as with question 2c, it is important that students consider how much time has passed to start considering rates of change.
b) Do you think that in 1942 people at the fort could see clearly through the inlet and out to sea? Why? No, the southward growth of the spit and associated southward migration of the inlet has blocked the view of the inlet from the fort.
c) In what general direction have the south end of Anastasia Island and Matanzas Inlet migrated since 1765? To the south
d) Think about the different things that affect coastlines and the way they look and change. Hypothesize a possible reason for the change in position of the island and inlet. Student answers will likely vary. All well-considered ideas should be accepted. The point of this is to start considering possible hypotheses, not necessarily to get the right answer. If students have already learned about longshore transport and spit development (see above references in the background information for teachers section), they may (and should) conclude that longshore transport in this area is from north to south and has resulted in the southward migration of the island and inlet. If they have not yet studied these phenomena, this is an opportunity to discuss these processes and other factors (sediment inputs/outputs, etc.) that affect coastline morphology.
5. Advance the animation one frame. The year is 1964. The island that the fort is on is called Rattlesnake Island.
a) Examine the area of Rattlesnake Island that is near the north end of Summer Haven Island (south side of the inlet).
b) Advance the animation 1 frame forward. The year is still 1964 and something significant occurs in northeast Florida. Hurricane Dora makes landfall and does much damage.
c) Look again at Rattlesnake Island and briefly describe any changes you observe. A “breakthrough” (new water flow path) was created in Rattlesnake Island near the inlet. This feature is highlighted on the animation.
6. Advance the animation one frame forward.
a) What year is shown? 1968 How many years have passed since Hurricane Dora struck? 4 years
b) Look at the north end of Summer Haven Island. In what general way did the north end of the island change since 1964 (the dashed line)? It retreated southward.
c) Pick a place where it looks like the most change occurred and use the map scale to estimate how much (how many feet) that area changed? Answers will vary but should be reasonable approximations given the scale of the map. To help in estimations, students can be encouraged to look at where the change was greatest.
d) Assuming a constant rate of change over that time, how fast did the end of the island retreat (how much change in feet/year)? Rate should be the above determined change divided by 4.
e) Hypothesize a possible reason for the change observed. Once again, think about the different things that affect coastlines and the way they look and change. Students’ answers will vary. Once again, it is important to stress the exploration of different ideas rather than determining the correct answer. In this case, the new breakthrough in Rattlesnake Island changed the flow of water from the Matanzas River out to the inlet (providing a new flow path). This likely had the effect of increasing erosion of the north end of Summer Haven Island hastening its southward retreat.
7. Advance to 1980, taking a few moments to view the 1972 frame.
a) Rattlesnake Island has changed once again, and so did the north end of Summer Haven Island. Generally, how does the change to this part of this part of the map between 1964 and 1972 compare to the change that occurred between 1972 and 1980? Between 1964 and 1972 the north end of Summer Haven Island retreated southward. Between 1972 and 180 it actually migrated back northward.
b) What might be a possible reason for why it changed this way? Student answers will vary. The breakthrough was filled in, once again changing the flow of water and sediment input to the inlet. Less water energy impacting the north end of Summer Haven Island may have allowed sediment from the river to accumulate there, resulting in a northward migration.
More notes for the teacher: A couple of Optional extensions. In each case, these ideas are intended to provide more detail and perspective and opportunity to move the students to a less scripted form of inquiry.
Optional Extension: Quantifying rates of change.
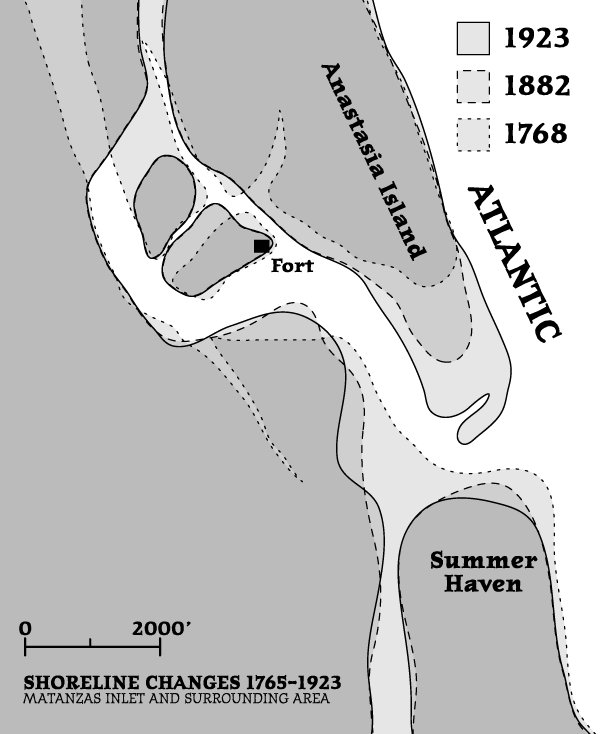
Figure 5. Map to accompany animation Shoreline Changes 1765-1992: Matanzas Inlet and Surrounding Area
Included with these materials is a static, printable, grayscale map (shown at left, below) that can be used as a student handout. The map shows the coastal outline for the first three time periods in the Matanzas Inlet animation (1765, 1882 and 1923). Additionally, dashed outlines on the map highlight the end of the south-growing spit that defines the southern end of Anastasia Island. To add more quantitative analysis to this investigation, students can use the map to determine the change in each time interval at a specific place on the spit. They can simply measure the distance and compare it to the scale bar). To mark their point of measurement, students should draw a reference line on the map that crosses the different coast outlines perpendicular to those boundaries at that place. Then, knowing the elapsed time and overall distance of growth, students can calculate and average rate of change for each of the two intervals. You can then engage students in various analyses of those conclusions, either graphically (plot change versus time, for example) or statistically or both. Opportunities exist in this extension to develop graphical analysis skills and simple statistics (averages, standard deviations). In this particular graph, the slope of the line through the data represents the rate of change that has occurred. Deviation from linearity is an artifact of changes in the rates of spit growth.
Optional extension: Human-induced change: Examining St. Augustine Inlet and the north end of Anastasia Island.
In the Matanzas Inlet, both continual, gradual change and punctuated storm damage (the Hurricane Dora break through and subsequent southward retreat of Summer Haven Island) were highlighted. In the case of the hurricane damage, though much more initially obvious coastal damage occurred from Hurricane Dora, this is an example of how storm damage can lead to a subsequent period of change and readjustment of the coastline.
Anthropogenic (human-caused) changes and coastal engineering efforts can also result in subsequent period of rapid change to a coast. For this example, students can examine an animation of the evolution of the north end of Anastasia island (St. Augustine Inlet.) This animation is available on the St. Augustine Lighthouse Museum website (http://www.staugustinelighthouse.com) under the heading St. Augustine’s Changing Coastline”. The animation can be directly accessed at http://www.staugustinelighthouse.com/coastline.php. This animation runs from 1741 to the present. Of particular note are changes that occurred after 1940 when the U.S. Army Corps of Engineers created the modern St. Augustine Inlet and fortified it with a jetty. Since that time a northward-growing spit has grown more about 2 miles or more. In this case, the flow of water and sediment to the coast was shifted resulting in a rapid northward growth of the spit.