Beach Profiling with "Emery Boards" and Measuring Sand Grain Size
Abstract
Using only a rope and two boards, students can measure the profile (shape) of a beach and examine the relationship between the beach profile and sand grain size. The beach profile is constructed from a series of measurements of beach elevations taken perpendicular to the shoreline, with the measurements being taken at intervals parallel to the shoreline. This is an excellent activity for a class field trip.
Introduction
Lots of people enjoy going to the beach. Some people like to play volleyball in the dry sand, some people like to surf on the breaking waves, and some people like to just lie down on a blanket and catch some rays. For whatever reason people like to go to the beach, it's worthwhile to know something about why the beach is shaped the way it is.
The shape of the beach is determined by two main factors:
- the waves approaching and breaking in the surf zone and
- the size of the individual sand grains on the beach.
Method
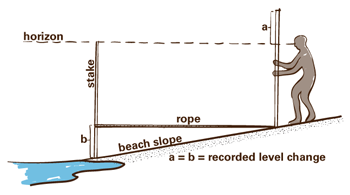
Figure 1. Illustration of the Emery Board technique.
Perhaps the simplest technique to measuring a beach profile is known as the "Emery board" method, developed by a famous coastal scientist named K.O. Emery. As depicted in Figure 1 the apparatus consists of two stakes connected by a rope of known length (5m or 10m). This length sets the measurement interval for individual data points along the profile. Each stake has a measurement scale which runs from 0 at the top, down to the bottom of the stake. Either English or Metric units can be used, although the scientific community is nearly completely converted to the metric system. If the beach is sloping downward toward the sea, the observer sights across the top of the seaward board to the level of the horizon, and determines the distance (a) from the top of the landward board to the sightline. If the beach is locally sloping upward in the offshore direction, then (a) is measured on the seaward board and the sighting is with the horizon over the top of the landward board. In either case, the measured distance (a) is equal to the distance (b) that the beach has either dropped or risen within the horizontal distance between the boards (the rope length). (Komar, 1998) This approach may seem simple, but it provides reasonably accurate measurements of beach profiles. It also has the advantages of light, inexpensive, equipment, which can be easily carried to distant survey sites, for very rapid surveys.
The technique of measuring sand size will be conducted in the field with the use of sand gauge charts. These are small, credit-card sized, plastic charts with calibrated samples of sieved sand mounted on the face. By using a hand-lens and sand gague chart, students may compare samples from the beach with calibrated samples on the chart for an estimate of size range.
Materials
To build a set of "Emery boards", the materials needed are two pieces of wood of equal length and a rope of known length. (Boards of 6-8 feet length will work well.) Tie a loop in each end of the rope, which can easily slide up and down the two boards. Measuring down from the top of each board, use a marker and a ruler to draw and label the "graduations" (marks of equal length). It is recommended that SI (system international) units are used for the exercise – an appropriate graduation interval is every two centimeters.
Sand gauge charts are available for a nominal fee ($10 - $12 each) from a number of vendors. One such distributor is ASC Scientific: (http://www.ascscientific.com/books.html).
Hand lenses are available, for a nominal fee ($10 - $100 each, depending on quality) from a number of vendors. One such distributor is Miners, from Riggins, Idaho (https://minerox.com).
Paper and pen or pencil are needed for recording data.
Activity - Fieldwork
Much of the enjoyment that comes along with a career in the geological sciences is the process of data collection in the field. For this exercise, the fieldwork takes place at a local beach.
- After arriving at the beach and selecting the site for beach profile measurement, students should split into groups of fours. The first task is to mark a line in the sand parallel to the shoreline. Call this line the baseline. The beach profile (i.e. elevations) will be measured along this baseline at specific intervals. These intervals will be designated the horizontal (along-the-coastline) distance (x).
- Each team of four students will have a "seaward surveyor", a "landward surveyor", a "geotechnical engineer" and a "data recorder". The "seaward surveyor" is responsible for holding the seaward board and ensuring that the rope is level between the two boards (by sliding the loop up or down) when fully extended. The "landward surveyor" is responsible for holding the landward board, sighting over the seaward board to the horizon (as described in the Methods section), and shouting out the measurement (cm down from the top of the landward board) to the "data recorder". The "geotechnical engineer" is responsible for moving with the "seaward surveyor" to collect a sand sample, and identify it using the hand lens on the basis of its size comparison to the sand gage chart. The "data recorder" should keep organized notes of each measurement including horizontal distance (x), measurement of change in elevation (a), cumulative change in elevation of all measurements, and sand size at each location. Students are encouraged to rotate positions within the team so everyone has experience with each task.
- Starting at the landward extent of the survey region (baseline), cross-shore data points of elevation and sand size are collected at the sampling interval determined by the length of the rope (distance between the two boards at full extension). Collect at least 5 cross shore data points. Collect more than 5 cross shore data points if the beach is wide.
- This process should be repeated at 4 locations (at least) to ensure that each student rotates through each task. The alongshore spacing of each profile should be uniform to cover a consistent reach of beach.
- Depending on how many students participate in the exercise, the class should be able to cover a significant alongshore portion of the beach.
Results - Data Analysis
Back in the classroom, students can participate in data analysis. This is often the first look that a scientist has at his/her data, and therefore the first opportunity they have to verify or reject some of their initial hypotheses.
Using the data of the beach profiles recorded by the class, the first step is to plot the cumulative vertical elevations (y-axis) as a function of horizontal position (x-axis). This will reveal the actual beach profile. It will also be valuable to plot slope against horizontal position as a measure of steepness. Slope is calculated by dividing the difference in elevation between any two adjacent points by the difference in horizontal distance between those two points. Remember, the units of elevation and distance must be consistent, so you’ll likely have to convert cm to meters. Lastly, a corresponding plot of grain size vs. horizontal position will help to illustrate the correspondence of material properties and beach shape. See the sample spreadsheet and plots for clarification of the analysis.
At first, the beach profile data may not appear to be very exciting – about like a horizontal line, if the horizontal and vertical scales are equal. This provides an opportunity to employ a common technique of geologists, geographers, and cartographers (map makers) called “vertical exaggeration ”. To employ vertical exaggeration, simply alter the vertical scale by a chosen factor (for example, a factor of 10) to accentuate subtle topographic features.
Click here to download the sample spreadsheet for this activity.
Interpretation of Results
The final step in the scientific process is the interpretation of the results. During this stage, students will be able to place their results in the context of the greater body of knowledge amassed by previous scientific investigations.
The results plotted in the graphs are better interpreted if we compare them to some of the work done by other scientists. Figure 2 shows a compilation of a significant amount of data on beach slopes and corresponding grain sizes. Can you identify where your beach would plot on such a diagram? Remember, “slope ratio” is simply the rise over the run, so if your beach slope is 0.05, that's the same as a slope ratio of 1 to 20, or 1:20.
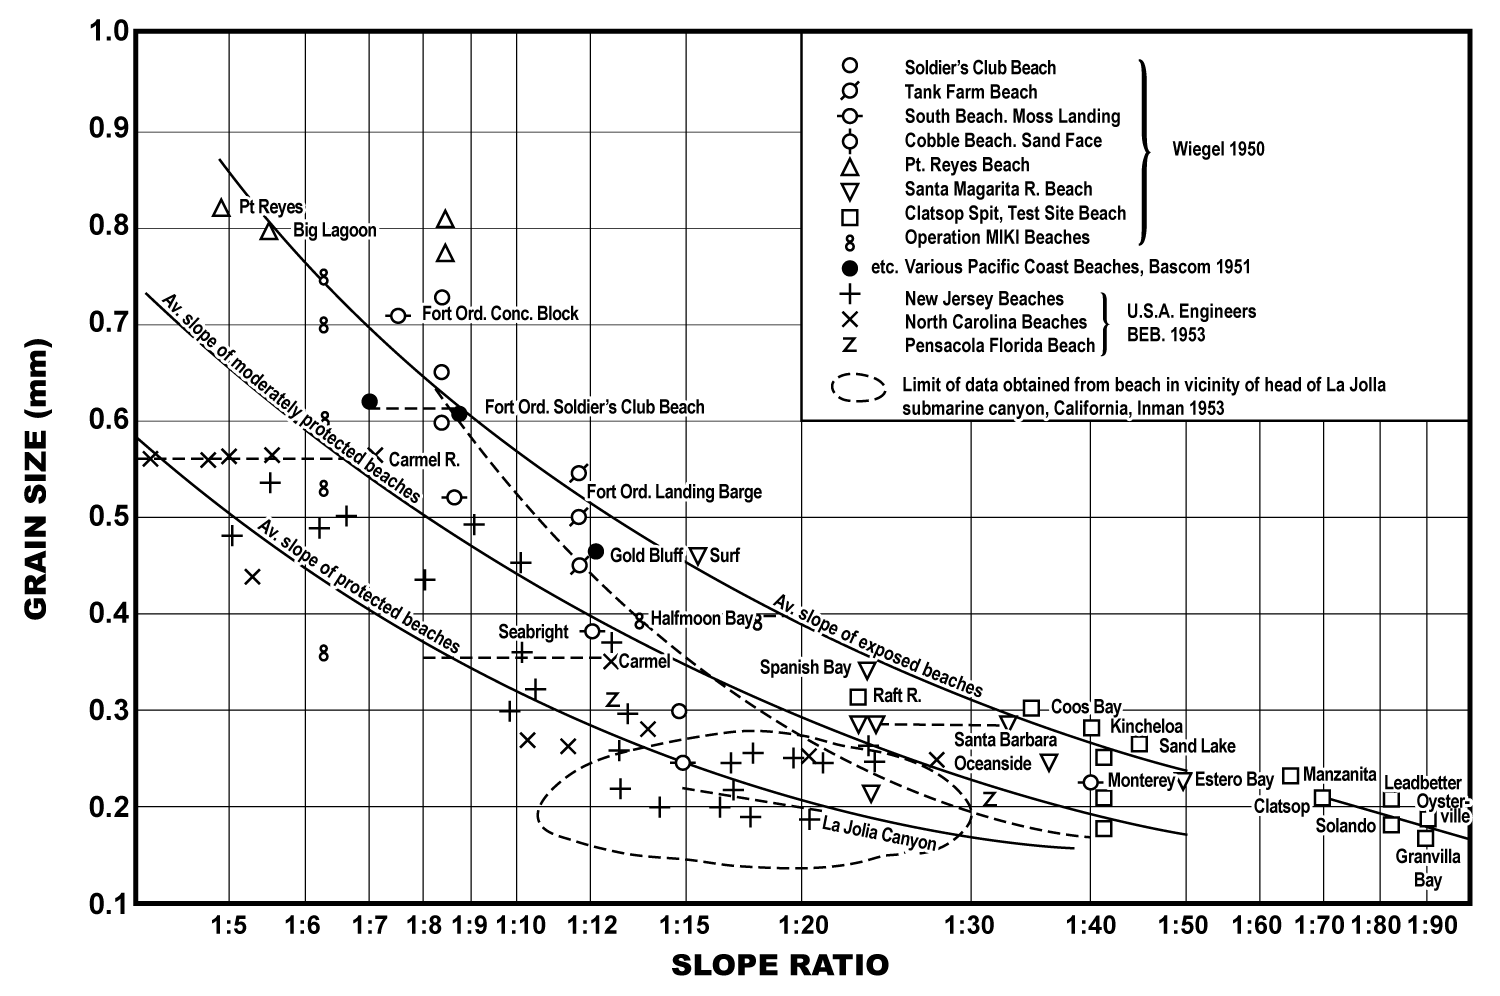
Figure 2. shows data from other scientists who measured beach slopes and sand grain sizes. Graph from Wiegel, R.L., 1965. Oceanographical Engineering, Prentice-Hall, 531 pages.
Reference: Komar, P.D., 1998. Beach Processes and Sedimentation. Prentice-Hall, Inc. 544 pages.