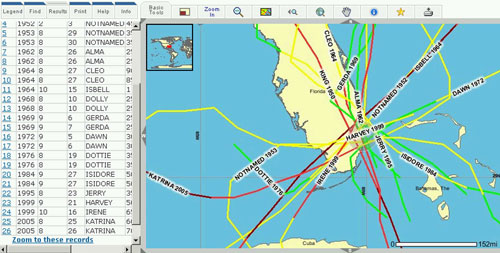
What part of Florida experiences the most hurricane strikes?
Equipment:
- websites
- spreadsheet or notebook within which to record data collected
This exercise uses an online searchable database to discover the locations of historic hurricane tracks. The database ends in 2006. At this National Oceanic and Atmospheric Admistration website (http://maps.csc.noaa.gov/hurricanes/), click "query storm tracks". Queries are based on location (state/county/city), intensity of storm, years (it is recommended to begin in 1950, when names were first routinely used), and months.


Part I: Search for the tracks of all tropical cyclones passing within a radius from the given location (for example, within 50 km of Union County). Students can be assigned different counties to query so that they can compare different parts of the state. Here are some of the data that they can research for their county/counties using this website (http://maps.csc.noaa.gov/hurricanes/):
- How many all-intensity occurrences have there been since 1950?
- How many hurricanes versus tropical depressions and tropical storms have occurred?
- How many major hurricanes (Category 3 or higher) have occurred?
- What is the frequency of occurrence for all storms, tropical storms, tropical depressions, hurricanes, and major hurricanes? (frequency = total number of events divided by number of years in period)
- When was the most recent occurrence?
- In what years did multiple occurrences happen?
- How many tracks actually passed through the county?
- How many tracks passed within 50 km to the right of the county? To the left?
- How many storms made landfall in the county?
- How many storms moved into the county from another county?
Part II: Potential economic impacts of tropical cyclone landfalls in Florida
Use this website (http://www.eflorida.com/floridasregionsSubpage.aspx?id=284) to obtain population and other socio-economic data about Florida's counties.
Use the data gained from the previous exercise pertaining to the number of tropical cyclones passing within 50 km of a county to answer the following questions:
- Which counties are the largest in area? Do the largest counties receive the most tracks?
- What counties contain the highest populations? Do counties with the largest populations also receive the most tracks?
- Do more people live in coastal counties versus inland counties? Do more tracks pass through coastal or inland counties?
- Which counties are projected to have the highest populations in 2030? Do these counties historically have frequent tracks?
Tracking Hurricanes: Where do hurricanes come from, and where do they go?
Equipment:
- pencil
- storm position information available from National Hurricane Center (NHC) storm reports at http://www.nhc.noaa.gov/pastall.shtml or from current forecast advisories at http://www.nhc.noaa.gov/
- tracking chart downloaded from the NHC website
This exercise will improve map reading skills, teach students how to plot the locations of tropical cyclones using latitude and longitude information, and help them learn the names of countries in the northern Atlantic basin and where they are located.
Latitude and longitude data are listed in decimal degrees. These locations represent the center of circulation, or “eye” if one is present. This is where the lowest pressure occurs. If the storm is over the ocean, we can use satellite data to determine where the eye is located. If it is closer to land, we can fly aircraft through the storm and use instruments aboard the aircraft to measure where the lowest pressure is encountered. Aircraft can also drop instrument packages that measure pressure, temperature, humidity, and winds as they fall towards the Earth’s surface.
The National Hurricane Center, located in Miami, Florida, has the responsibility to monitor, forecast, and post watches and warnings for tropical cyclones occurring in both the North Atlantic and Northeast Pacific Ocean basins. Their forecasts and advisories are updated every six hours. If you live in the Eastern time zone, you can log onto the NHC website (http://www.nhc.noaa.gov/) and read the latest information at 5:00 AM, 11:00 AM, 5:00 PM, and 11:00PM. If a storm nears landfall, updates are issued every three hours.
| Date/Time (UTC) | Latitude (Nº) | Longitude (Wº) | Pressure (mb) | Wind Speed (kt) | Stage |
|---|---|---|---|---|---|
| 05/0600 | 27.3 | 79.7 | 1006 | 35 | tropical storm |
| 05/1200 | 28.3 | 80.2 | 1004 | 40 | " |
| 05/1800 | 29.5 | 80.9 | 1001 | 45 | " |
| 06/0000 | 30.5 | 81.6 | 1002 | 45 | " |
| 06/0600 | 31.3 | 82.8 | 1005 | 35 | " |
| 06/1200 | 31.8 | 84.6 | 1005 | 25 | tropical depression |
| 06/1800 | 31.2 | 85.8 | 1006 | 15 | " |
| 07/0000 | 30.3 | 85.6 | 1005 | 10 | remnant low |
| 07/0600 | |||||
| 05/2300 | 30.4 | 81.4 | 1002 | 45 | landfall near Atlantic Beach, Florida |
| 05/1800 | 29.5 | 80.9 | 1001 | 45 | minimum pressure |
To obtain circulation center positions from previous storms, click on the link to “Past Seasons”, select the year, then select the storm. The data available include the six-hourly coordinates plus the pressure, wind speed, and intensity category. Listed at the bottom are data from when it was most intense, and any landfalls made.