|
|
|
| FL Maps > Local > Collier |
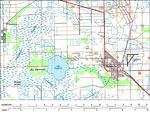
Click on a thumbnail image to view a full size version of that map.
|
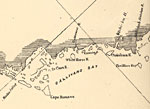
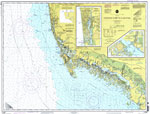
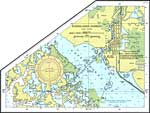
Detail - Preliminary chart of the northeastern part of the Gulf of Mexico,
1861 |
|
Arzell,
1936 |
|
Belle Meade,
1936 |
|
Carnestown,
1936 |
|
Immokalee,
1985 |
|
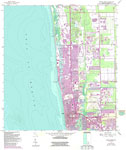
Naples Park and Palm River Estates,
1985 |
|
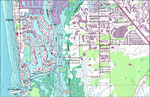
Naples and East Naples,
1985 |
|
Rookery Bay Area,
1985 |
|
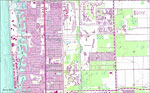
Naples South,
1987 |
|
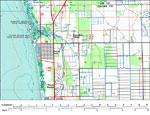
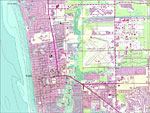
Naples North,
1987 |
|
South Naples,
1987 |
|
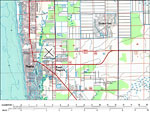
Central Naples,
1987 |
|
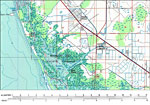
North Naples,
1987 |
|
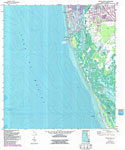
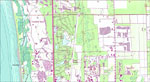
North Central Naples,
1987 |
|
Chatham River to Clam Pass,
1999 |
|
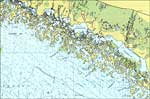
Ten Thousand Islands,
1999 |
|
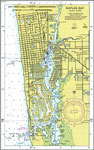
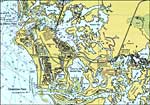
Naples Bay,
1999 |
|
Everglades Harbor,
1999 |
|
Marco Island,
1999 |
| FL Maps > Local > Collier |
Maps ETC
is a part of the
Educational Technology Clearinghouse
Produced by the
Florida Center for Instructional Technology
© 2007
College of Education
,
University of South Florida