Maps Site map
  FL Maps > Region > 2000-
Site Map  

  Record   1   to   25  of   217

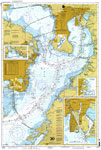
Tampa Bay, 2000
A National Oceanic and Atmospheric Administration map of Tampa Bay current to 2000. This Department of Commerce chart shows all soundings expressed in feet at mean lower low water. Safety Harbor, St. Petersburg, Davis Island and Hookers Point are det...

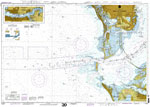
Tampa Bay Entrance, 2000
A National Oceanic and Atmospheric Administration map of Tampa Bay Entrance current to 2000. This Department of Commerce chart shows all soundings expressed in feet at mean lower low water. Detailed map of Manatee River extension is included. Naviga...

South Pinellas and Tampa Bay, 2000
A National Oceanic and Atmospheric Administration map of Tampa Bay Entrance current to 2000. This Department of Commerce chart shows all soundings expressed in feet at mean lower low water. Navigational aids such as lights, beacons, buoys and measure...

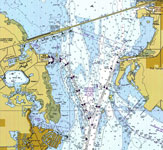
Port Tampa, 2000
A National Oceanic and Atmospheric Administration map of the Port Tampa area including the Gandy Bridge current to 2000. This Department of Commerce chart shows all soundings expressed in feet at mean lower low water. Navigational aids such as lights...

Safety Harbor, 2000
A National Oceanic and Atmospheric Administration map of Safety Harbor area including Courtney Cambell Parkway current to 2000. This Department of Commerce chart shows all soundings expressed in feet at mean lower low water. Navigational aids such as...

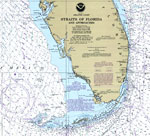
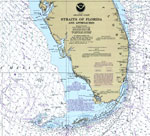
Straits of Florida and Approaches, 2000
A portion of the National Oceanic and Atmospheric Administration map of the Straits of Florida. This National Ocean Survey chart shows all soundings expressed in fathoms. Navigational aids such as the direction and velocity of the Gulf Stream, measur...

Straits of Florida, 2000
A National Oceanic and Atmospheric Administration map of the Straits of Florida, north from Tampa and south to the Keys. This National Ocean Survey chart shows all soundings expressed in fathoms. Navigational aids such as the direction and velocity o...

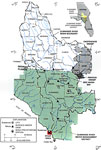
Suwannee River Basin Study Area Fig. 1, 2000
This map from the U. S. Geological Survey Water Resources Investigation Report number 99-4268 shows both the Florida and Georgia sections of the Suwannee River Drainage Basin from the contributing watershed of its headwaters in the Okefenokee Swamp t...

Lower Reach of the Suwannee River , 2000
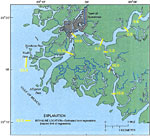
This map from the U. S. Geological Survey Water Resources Investigation Report number 99-4268 shows the lower reach of the Suwannee River and Suwannee River Estuary. The map also shows the town of Suwannee, inland water systems, major roads, and the ...

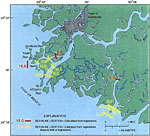
Averaged Salinity Distribution in the Suwanne River Estuary Under High-Flow Conditions, 2000
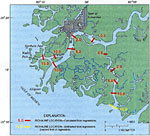
This map from the U. S. Geological Survey Water Resources Investigation Report number 99-4268 shows vertically averaged salinity distribution in the upper Suwannee River Estuary near Suwannee, Florida, under high-flow conditions. Regression analyses ...

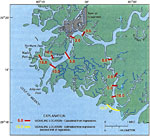
Averaged Salinity Distribution in the Suwanne River Estuary Under Medium-Flow Conditions, 2000
This map from the U. S. Geological Survey Water Resources Investigation Report number 99-4268 shows vertically averaged salinity distribution in the upper Suwannee River Estuary near Suwannee, Florida, under medium-flow conditions. Regression analyse...

Averaged Salinity Distribution in the Suwanne River Estuary Under Low-Flow Conditions, 2000
This map from the U. S. Geological Survey Water Resources Investigation Report number 99-4268 shows vertically averaged salinity distribution in the upper Suwannee River Estuary near Suwannee, Florida, under low-flow conditions. Regression analyses s...

Averaged Salinity Distribution After Withdrawal in the Suwanne River Estuary Under High-Flow Conditions, 2000
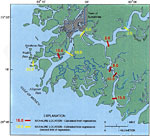
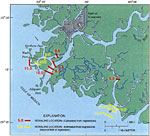
This map from the U. S. Geological Survey Water Resources Investigation Report number 99-4268 shows vertically averaged salinity distribution in the upper Suwannee River Estuary near Suwannee, Florida, estimated for a 1,000 cubic feet per second with...

Averaged Salinity Distribution After Withdrawal in the Suwanne River Estuary Under Medium-Flow Conditions, 2000
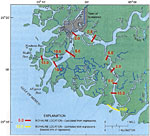
This map from the U. S. Geological Survey Water Resources Investigation Report number 99-4268 shows vertically averaged salinity distribution in the upper Suwannee River Estuary near Suwannee, Florida, estimated for a 1,000 cubic feet per second with...

Averaged Salinity Distribution After Withdrawal in the Suwanne River Estuary Under Low-Flow Conditions, 2000
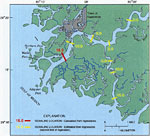
This map from the U. S. Geological Survey Water Resources Investigation Report number 99-4268 shows vertically averaged salinity distribution in the upper Suwannee River Estuary near Suwannee, Florida, estimated for a 1,000 cubic feet per second with...

Averaged Salinity Distribution After Withdrawal in the Suwanne River Estuary Under High-Flow Conditions, 2000
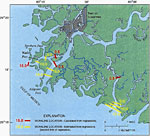
This map from the U. S. Geological Survey Water Resources Investigation Report number 99-4268 shows vertically averaged salinity distribution in the upper Suwannee River Estuary near Suwannee, Florida, estimated for a 10 per cent withdrawal scenario ...

Averaged Salinity Distribution After Withdrawal in the Suwanne River Estuary Under Medium-Flow Conditions, 2000
This map from the U. S. Geological Survey Water Resources Investigation Report number 99-4268 shows vertically averaged salinity distribution in the upper Suwannee River Estuary near Suwannee, Florida, estimated for a 10 per cent withdrawal scenario ...

Averaged Salinity Distribution After Withdrawal in the Suwanne River Estuary Under Low-Flow Conditions, 2000
This map from the U. S. Geological Survey Water Resources Investigation Report number 99-4268 shows vertically averaged salinity distribution in the upper Suwannee River Estuary near Suwannee, Florida, estimated for a 10 per cent withdrawal scenario ...

Manatee River Watershed, 2000
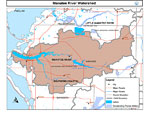
This is a map from the Southwest Florida Watershed Management District or SWFWMD of the Manatee River watershed. This map shows the Comprehensive Watershed Management or CWM boundary shown by the thick gray line and outstanding Florida waters highlig...

107th Congress - Florida's Congressional District 1, 2001
This is a map of Florida's Congressional District 1 in the Congressional Districts of the United States - 107th Congress. It shows main cities, state roads, U. S. highways and county names....

107th Congress - Florida's Congressional District 2, 2001
This is a map of Florida's Congressional District 2 in the Congressional Districts of the United States - 107th Congress. It shows main cities, state roads, U. S. highways and county names....

107th Congress - Florida's Congressional District 3, 2001
This is a map of Florida's Congressional District 3 in the Congressional Districts of the United States - 107th Congress. It shows main cities, state roads, U. S. highways and county names....

107th Congress - Florida's Congressional District 4, 2001
This is a map of Florida's Congressional District 4 in the Congressional Districts of the United States - 107th Congress. It shows main cities, state roads, U. S. highways and county names....

107th Congress - Florida's Congressional District 5, 2001
This is a map of Florida's Congressional District 5 in the Congressional Districts of the United States - 107th Congress. It shows main cities, state roads, U. S. highways and county names....

107th Congress - Florida's Congressional District 6, 2001
This is a map of Florida's Congressional District 6 in the Congressional Districts of the United States - 107th Congress. It shows main cities, state roads, U. S. highways and county names....

Next Last


  FL Maps > Region > 2000-
Site Map  

Maps ETC is a part of the Educational Technology Clearinghouse
Produced by the Florida Center for Instructional Technology © 2007
College of Education , University of South Florida