|
|
|
| FL Maps > Region > 2000- |
|
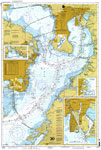
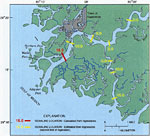
Tampa Bay,
2000 |
|
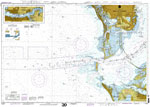
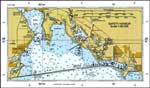
Tampa Bay Entrance,
2000 |
|
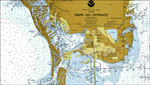
South Pinellas and Tampa Bay,
2000 |
|
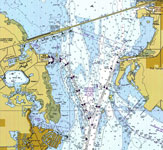
Port Tampa,
2000 |
|
Safety Harbor,
2000 |
|
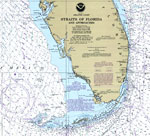
Straits of Florida and Approaches,
2000 |
|
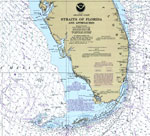
Straits of Florida,
2000 |
|
Suwannee River Basin Study Area Fig. 1,
2000 |

|
Lower Reach of the Suwannee River ,
2000 |
|
Averaged Salinity Distribution in the Suwanne River Estuary Under High-Flow Conditions,
2000 |
|
Averaged Salinity Distribution in the Suwanne River Estuary Under Medium-Flow Conditions,
2000 |
|
Averaged Salinity Distribution in the Suwanne River Estuary Under Low-Flow Conditions,
2000 |
|
Averaged Salinity Distribution After Withdrawal in the Suwanne River Estuary Under High-Flow Conditions,
2000 |
|
Averaged Salinity Distribution After Withdrawal in the Suwanne River Estuary Under Medium-Flow Conditions,
2000 |
|
Averaged Salinity Distribution After Withdrawal in the Suwanne River Estuary Under Low-Flow Conditions,
2000 |
|
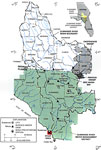
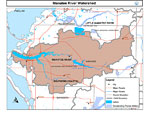
Manatee River Watershed,
2000 |
|
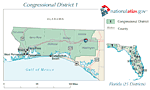
107th Congress - Florida's Congressional District 1,
2001 |
|
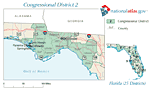
107th Congress - Florida's Congressional District 2,
2001 |
|
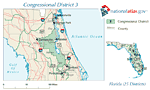
107th Congress - Florida's Congressional District 3,
2001 |
|
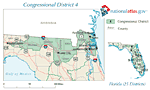
107th Congress - Florida's Congressional District 4,
2001 |
|
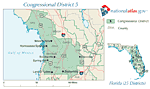
107th Congress - Florida's Congressional District 5,
2001 |
|
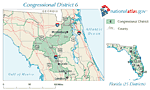
107th Congress - Florida's Congressional District 6,
2001 |
| Next | Last |
| FL Maps > Region > 2000- |
Maps ETC
is a part of the
Educational Technology Clearinghouse
Produced by the
Florida Center for Instructional Technology
© 2007
College of Education
,
University of South Florida