|
Get
a Half-life!: Teacher Notes

MA.8.S.3.1
MA.912.A.3.11
MA.912.A.8.7

Conceptual Understanding
Data Collection
Graphing Calculator
Line of Best Fit
Interpret Data
Functions
Procedural Knowledge
Calculator Commands
Exponential Decay
Organize Data
Graph Data
Curve of Best Fit

Problem Solving
Reasoning
Communication
Connections
Representation

A decay function is one
in which the values decrease by a constant factor, but it is not linear!
These functions are often used to model the decay of a radioactive
element. The half-life of a substance is the time it takes to reduce
its initial effectiveness by one-half.

Students work in pairs.

Each pair needs:
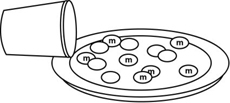
- 1 cup of m&m's
- 1 paper plate or box
- 1 graphing calculator

- Collect the Data
- Pour m&m's out and count your beginning sample size
(N). This will be your N value when T = 0. Enter this value in
the table below and put the m&m's back in the cup.
- Shake the cup gently and pour the m&m's out in the
box or on the paper plate.
- Remove all the m&m's with an "m" showing.
(You may eat these m&m's only!)
- Count the remaining m&m's and enter this value of
N into your table next to T = 1.
- Put the remaining m&m's back in the cup.
- Repeat this process until there are no longer any m&m's
with the letter "m" when you empty your cup.
| Trial
Number (T) |
0
|
1
|
2
|
3
|
4
|
5
|
6
|
7
|
| #
of remaining m&m’s (N) |
|
|
|
|
|
|
|
|
- Use the Calculator
- Clear out the calculator:
Press [2nd][Y=]. Enter [4]. Press [ENTER]. This turns off all
plots.
Press [Y=], [CLEAR], down arrow and [CLEAR] until all equations
are cleared.
Press [STAT], [ENTER] to view tables. To clear Lists, press up
arrow to highlight L1, press [CLEAR], [ENTER]. Use arrow keys
to highlight any other lists and clear.
- Enter the data from the table above:
Press [STAT], choose EDIT by pressing [ENTER] and enter values
of T in L1 using down arrow keys and [ENTER].
Use right arrow key to move over to L2 and enter the values of
N in L2.
- Graph the Data
Press [STAT PLOT] ([2nd][Y=]), choose 1 by pressing [ENTER].
Highlight: ON
Broken line graph
Xlist: L1
Ylist: L2
Mark: first one
Press [ZOOM], then [9] to set up appropriate window and see graph.
- Have the calculator determine the best equation for the data.
Linear:
Press [STAT]. Choose CALC[5].
Type in L1, L2 (press [2nd][1][,][2nd][2] then [ENTER]). You will
see y = ax + b and values for a, b, and r.
Press [Y=], set cursor next to Y1=, press [VARS][5], arrow over
to EQ, press [7], the [GRAPH].
Quadratic:
Press [STAT], choose CALC [6], then type in L1, L2 (like above)
and press [ENTER].
Press [Y=]. Set your cursor next to Y2=.
Press [VARS][5], arrow over to EQ, press [7], the [GRAPH]. (Adjust
the window here to see more of this graph)
Exponential:
Press [STAT] and choose CALC . Choose A by using the down arrow
key until you see "A ExpReg". Press [ENTER].
Type in L1, L2 as before and then [ENTER]. You will see y = a*b^x
(y = abx) and values for a, b, and r.
Press [Y=] and set your cursor next to Y3=.
Press [VARS], choose [5], arrow over to EQ, press [7], then [GRAPH].
- Analyze the Data
- Which graph most clearly approximates a "curve of best
fit" for your data?
- Why is this called a "half-life"?
- What is a good estimate for the length of a "half-life"
of m&m's based on your research?

As a result of this activity,
students learn to model a real-life situation by collecting data from
a few trials, graphing the data, and then drawing a curve of best
fit. The student must decide which of the equations best fits his/her
data. Sometimes when a student gathers his/her own data, the graph
does not make a perfect line or curve.

- Describe the factors that
influenced you to choose your "curve of best fit".
- Explain how each of the three types of equations, linear, quadratic,
and exponential, are different.
|