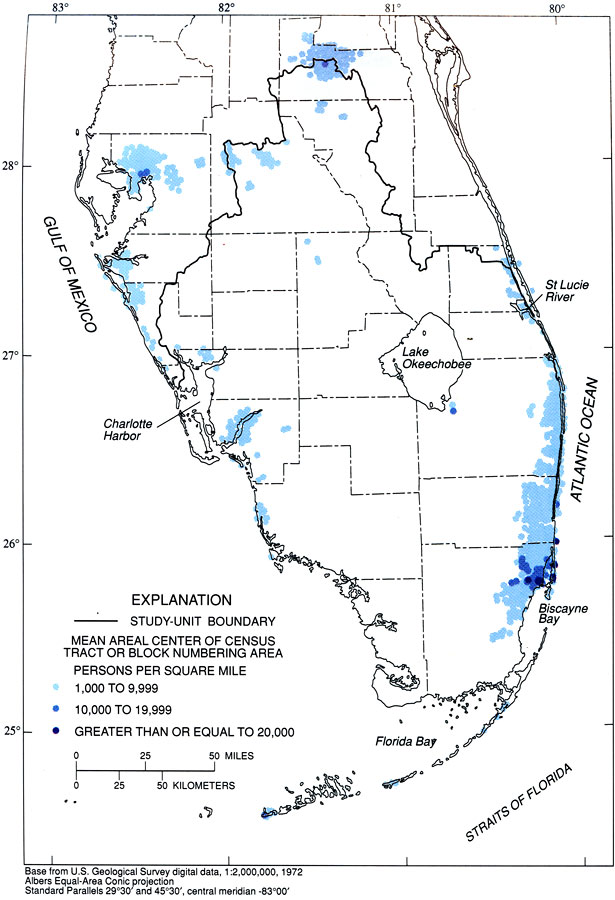
Description: This map from the U. S. Geological Survey Circular 1134, The South Florida Environment, shows the population density in south Florida based on 1990 Census data. The map shows the mean areal center of census tract or block numbering area in terms of persons per square mile. The density ranges from 1,000 persons per square mile to greater than or equal to 20,000 persons per square mile.
Place Names: 1950-1999, Gulf of Mexico, Charlotte Harbor, Ten Thousand Islands, Whitewater Bay, Florida Bay, Biscayne Bay, Straits of Florida, Everglades, Atlantic Ocean, St. Lucie River, Lake Okeechobee, Kissimmee River, Myakka River, Peace River, Caloosahatchee River
ISO Topic Categories: boundaries, inlandWaters, oceans
Keywords: Population Density in South Florida, physical, political, statistical, kpopulation, physical features, local jurisdictions, county borders, population, boundaries, inlandWaters, oceans, Albers_Conical_Equal,1990
Source: B. F. McPherson and R. Halley, USGS Circular 1134 (Washington, DC: U. S. Government Printing Office, 1996) 33
Map Credit: Courtesy the University of South Florida Library |
|