Maps Site map
  FL Maps > State > 2000-
Site Map  

  Record   1   to   25  of   55

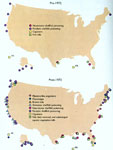
Harmful Algal Blooms, 1972
Map indicates the affects of algal blooms in the waters around the U.S. from 1972 to present. Map lists such examples as Macroalgae, Ciguatera, fish kills, Paralyic shellfish poisoning, and more. ...

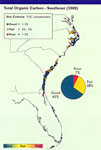
Water Quality Index for Southeast, 2000
Map shows the water quality index data for Southeast Coast in 2000 C.E. The number of component indicators ranges from poor to fair conditions. ...

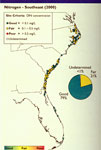
Nitrogen in Southeast, 2000
Map shows DIN concentration data for Southeast Coast estuaries in 2000 C.E. Levels of nitrogen range from good to poor, with good being less than 0.1 mg/L DIN concentration and poor being more than 0.5 mg/L DIN concentration. ...

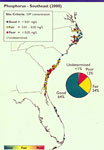
Phosphorus in Southeast, 2000
Map shows DIP concentration data for Southeast Coast estuaries in 2000 C.E. Levels of phosphorus range from good to poor, with poor being greater than 0.05 mg/L DIP concentration and good being less than 0.01 mg/L DIP concentration....

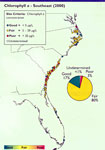
Chlorophyll a in Southeast, 2000
Map of Chlorophyll a concentration data for Southeast Coast Estuaries in 2000 C.E. Levels of chlorophyll a range from good to poor. ...

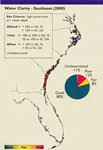
Water Clarity in Southeast, 2000
Map shows water clarity in the Southeast United States during the year 2000 C.E. Levels of clarity range from good to poor. With some states percentages differing from others due to water conditions and locations. ...

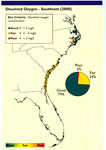
Dissolved Oxygen in Southeast, 2000
Map shows dissolved oxygen concentration data for Southeast Coast estuaries of the United Stated in 2000 C.E. Levels range from good to poor, with poor being less than 2 mg/L dissolved oxygen concentration and good being greater than 5 mg/L dissolved...

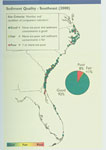
Sediment Quality in Southeast, 2000
Map shows the sediment quality index data for the Southeast Coast estuaries of the United States in 2000 C.E. Quality levels range from poor to good. ...

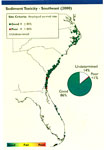
Sediment Toxicity in Southeast, 2000
Map shows sediment toxicity data for Southeast Coast estuaries in the United States in 2000 C.E. Levels are good or poor, with good being greater than or equal to 80% amphipod survival rate and poor being less than 80% amphipod survival rate. ...

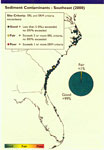
Sediment Contaminants in Southeast, 2000
Map shows the sediment contaminant data in the Southeast Coast estuaries in the United States in 2000 C.E. Levels range from good to poor. ...

Cattle and Calves Inventory, 2000
This map shows "Cattle and Calves Inventory" in Florida from the Agriculture Census of the United States map. This is a revised version of the April, 2000, data set....

Total Cropland, 2000
This map shows "Total Cropland" in Florida from the Agriculture Census of the United States map. This is a revised version of the April, 2000, data set....

Vegetables Harvested for Sale, 2000
This map shows "Vegetables Harvested for Sale" in Florida from the Agriculture Census of the United States map. This is a revised version of the April, 2000, data set....

Broiler and other Meat-Type Chickens Sold, 2000
This map shows "Broiler and Other Meat-Type Chickens Sold" in Florida from the Agriculture Census of the United States map. This is a revised version of the April, 2000, data set....

Number of Farms, 2000
This map shows "Number of Farms" in Florida from the Agriculture Census of the United States map. This is a revised version of the April, 2000, data set....

Hogs and Pigs Inventory, 2000
This map shows "Hogs and Pigs-Inventory" in Florida from the Agriculture Census of the United States map. This is a revised version of the April, 2000, data set....

Irrigated Land in Farms, 2000
This map shows "Irrigated Land in Farms" in Florida from the Agriculture Census of the United States map. This is a revised version of the April, 2000, data set....

Land in Orchards, 2000
This map shows "Land in Orchards" in Florida from the Agriculture Census of the United States map. This is a revised version of the April, 2000, data set....

Acres of Pecans, 2000
This map shows "Acres of Pecans" in Florida from the Agriculture Census of the United States map. This is a revised version of the April, 2000, data set....

Value of Crops Sold, 2000
This map shows "Value of Crops Sold" in Florida from the Agriculture Census of the United States map. This is a revised version of the April, 2000, data set....

Market Value of Agricultural Products Sold, 2000
This map shows "Market Value of Agricultural Products Sold" in Florida from the Agriculture Census of the United States map. This is a revised version of the April, 2000, data set....

Value of Livestock, Poultry and Their Products Sold, 2000
This map shows "Value of Livestock, Poultry, and their Products Sold" in Florida from the Agriculture Census of the United States map. This is a revised version of the April, 2000, data set....

Value of Nursery Crops Grown for Sale, 2000
This map shows "Value of Nursery Crops Grown for Sale" in Florida from the Agriculture Census of the United States map. This is a revised version of the April, 2000, data set....

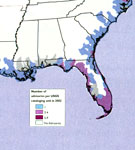
Coastal and Estuarine Fish Consumption Advisories, 2002
Map indicates the numbers of coastal and estuarine fish consumption advisories. Number of advisories are indicated from no advisories up to 9 is some areas. ...

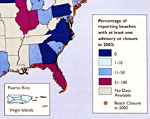
Marine Beach Closures or Advisories, 2002
Map indicates the number, if any, of beaches that had advisories or closed down at some point in 2002. The numbers range from no beach closures up to 100 in some areas. ...

Next Last


  FL Maps > State > 2000-
Site Map  

Maps ETC is a part of the Educational Technology Clearinghouse
Produced by the Florida Center for Instructional Technology © 2007
College of Education , University of South Florida