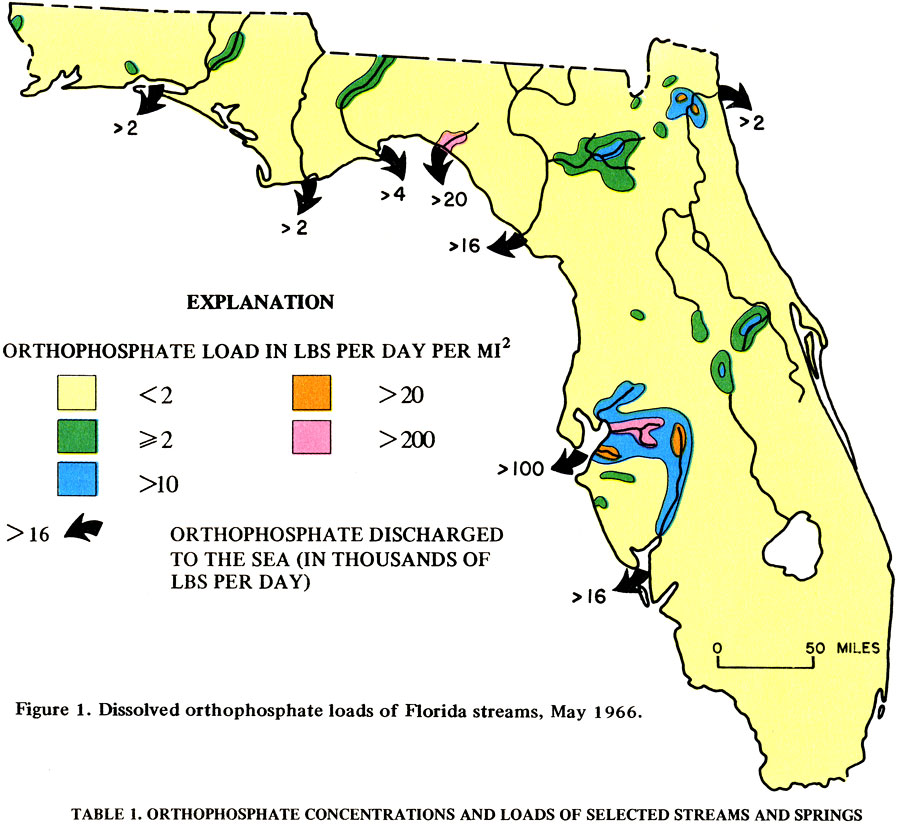
Description: This map shows the dissolved orthophosphate loads of Florida streams in pounds per mile squared, May 1966. The black arrows show orthophosphate discharged to the sea in thousands of pounds per day. Please see the article Generalized Distribution and Concentration of Orthophosphate in Florida Streams Matthew I. Kaufman for more information.
Place Names: 1950-1999, Counties, Hillsborough, Gulf of Mexico, Lake Okeechobee, Orange
ISO Topic Categories: boundaries, geoscientificInformation, environment, inlandWaters, oceans
Keywords: Orthophosphate Load in Pounds per Mile Squared, physical, hydrological, boundaries, geoscientificInformation, environment, inlandWaters, oceans, Unknown,1975
Source: U. S. Geological Survey, Bureau of Geology, Florida Department of Natural Resources , Florida Water Atlas (Tallahassee, FL: Bureau of Geology, 1976)
Map Credit: Courtesy the University of South Florida Library |
|