|
|
|
| FL Maps > State > 1950-1999 |
|
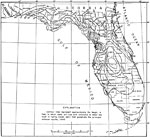
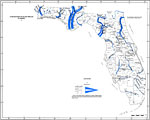
Piezometric Surface of Florida,
1951 |
|
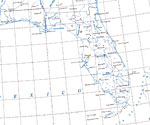
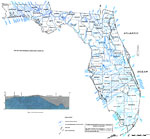
Florida Lakes and Rivers,
1954 |
|
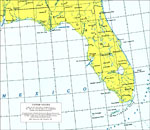
Florida,
1957
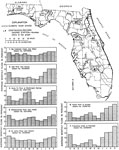
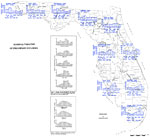
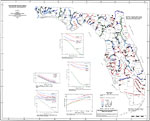
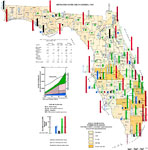
Monthly Variation of Streamflow,
1957 to 1987 |
|
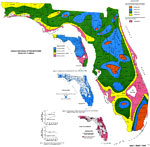
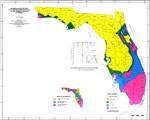
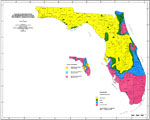
Geologic Map of Florida,
1964 |
|
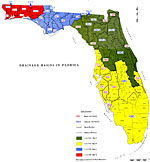
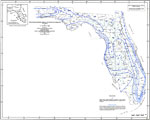
Drainage Basins in Florida,
1967 |
|
Ground-Water Features in Escambia and Santa Rosa Counties, Florida- Figure 1,
1967 |
|
Seasonal Variation of Streamflow,
1969 |
|
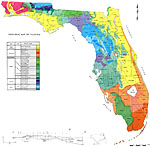
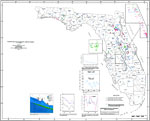
Top of the Floridian Artesian Aquifer,
1973 |
|
Observation Well Network,
1974 |
|
Low Streamflow in Florida- Magnitude and Frequency,
1974 |
|
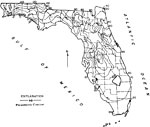
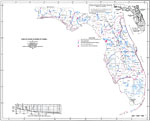
Surface Water Features,
1974 |
|
Water-Level Fluctuations of Lakes,
1974 |
|
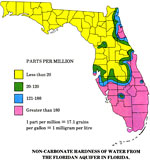
Non-Carbonate Hardness of Water from Floridian Aquifer,
1975 |
|
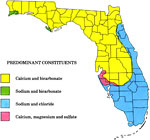
Predominant Constituents of Dissolved Solids,
1975 |
|
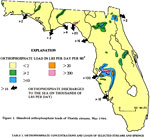
Orthophosphate Load in Pounds per Mile Squared,
1975 |
|
Estimated Water Use in Florida,
1975 |
|
Estimated Yield of Fresh-Water Wells,
1975 |
|
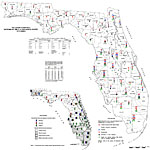
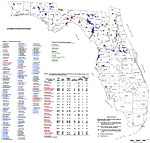
An Index to Springs of Florida,
1975 |
|
Difference Between Rainfall and Potential Evaporation,
1975 |
|
Average Flow of Major Streams,
1975 |
|
Chloride Concentration in Water,
1975 |
|
Sulfate Concentration in Water,
1975 |
|
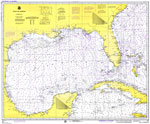
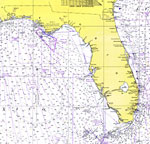
Gulf of Mexico,
1975 |
|
Florida and the Gulf of Mexico,
1975 |
| Next | Last |
| FL Maps > State > 1950-1999 |
Maps ETC
is a part of the
Educational Technology Clearinghouse
Produced by the
Florida Center for Instructional Technology
© 2007
College of Education
,
University of South Florida