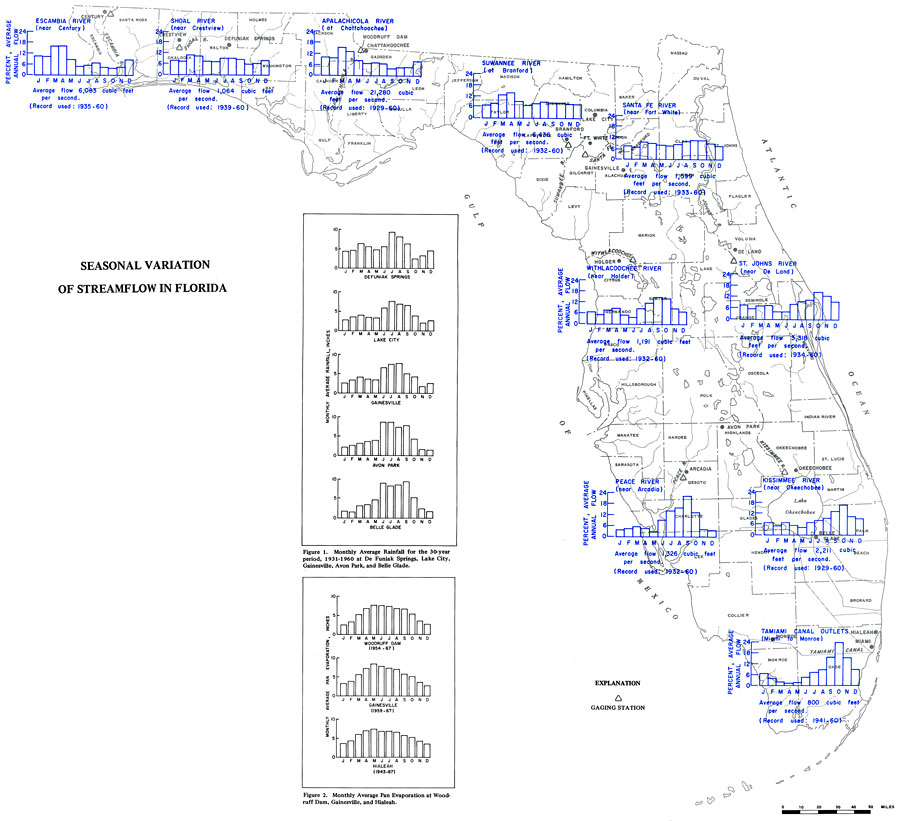
Description: This is a map showing the seasonal variation of streamflow in Florida, current to 1969. The following is taken from the article "Seasonal Variation of Streamflow in Florida" by W. E. Kenner — "Florida's variation of streamflow is unusual in two respects. First, the month-to-month variation in average streamflow is relatively small; second, the seasonal variations of streams in different sections of the state are different. A convenient way to show seasonal variations of streamflow is to graphically compare monthly average flow, in terms of the percentage of average annual flow as shown in the map." The triangles on the map are gauging stations. Please see the article Seasonal Variations of Streamflow in Florida by W. E. Kenner for more information.
Place Names: 1950-1999, Counties, Hillsborough, Atlantic Ocean, Gulf of Mexico, Lake Okeechobee, Orange, St. Johns River, Suwannee River
ISO Topic Categories: boundaries, inlandWaters, oceans, environment
Keywords: Seasonal Variation of Streamflow, hydrological, physical, streams, boundaries, inlandWaters, oceans, environment, Unknown,1969
Source: U. S. Geological Survey, Bureau of Geology, Florida Department of Natural Resources , Florida Water Atlas (Tallahassee, FL: Bureau of Geology, 1976)
Map Credit: Courtesy the University of South Florida Library |
|