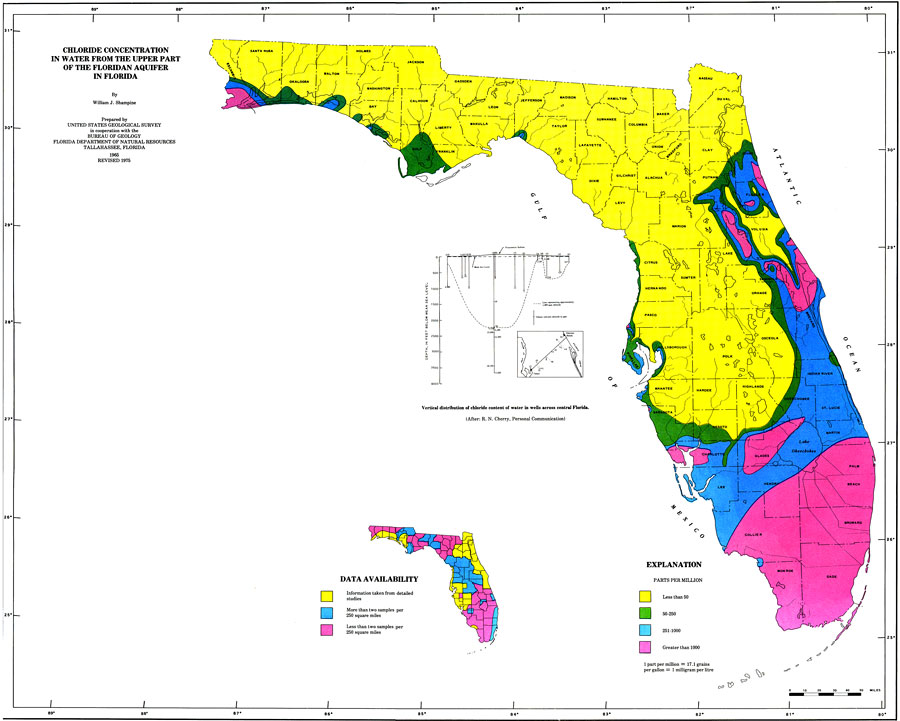
Description: This is a map showing general trends in the chloride concentration in water from the upper part of the Floridian Aquifer in Florida, current to 1975. The following is taken from the article "Chloride Concentration in Water from the Upper Part of the Floridian Aquifer in Florida" by William J. Shampine — "Below this part of the aquifer, high chloride water can be found everywhere in the state. Chloride concentration in local areas may deviate from the values represented." The key shows parts per million of chloride; yellow means less than 50, green is 50-250, blue is 251-1000 and pink is greater than 1000. 1 part per million is 17.1 grains per gallon and that is 1 milligram per liter. Please see the article Chloride Concentration in Water from the Upper Part of the Floridian Aquifer in Florida by William J. Shampine for more information.
Place Names: 1950-1999, Counties, Hillsborough, Atlantic Ocean, Gulf of Mexico, Lake Okeechobee, Orange, St. Johns River, Suwannee River
ISO Topic Categories: boundaries, inlandWaters, oceans, environment
Keywords: Chloride Concentration in Water, hydrological, physical, chloride, boundaries, inlandWaters, oceans, environment, Unknown,1975
Source: U. S. Geological Survey, Bureau of Geology, Florida Department of Natural Resources , Florida Water Atlas (Tallahassee, FL: Bureau of Geology, 1976)
Map Credit: Courtesy the University of South Florida Library |
|