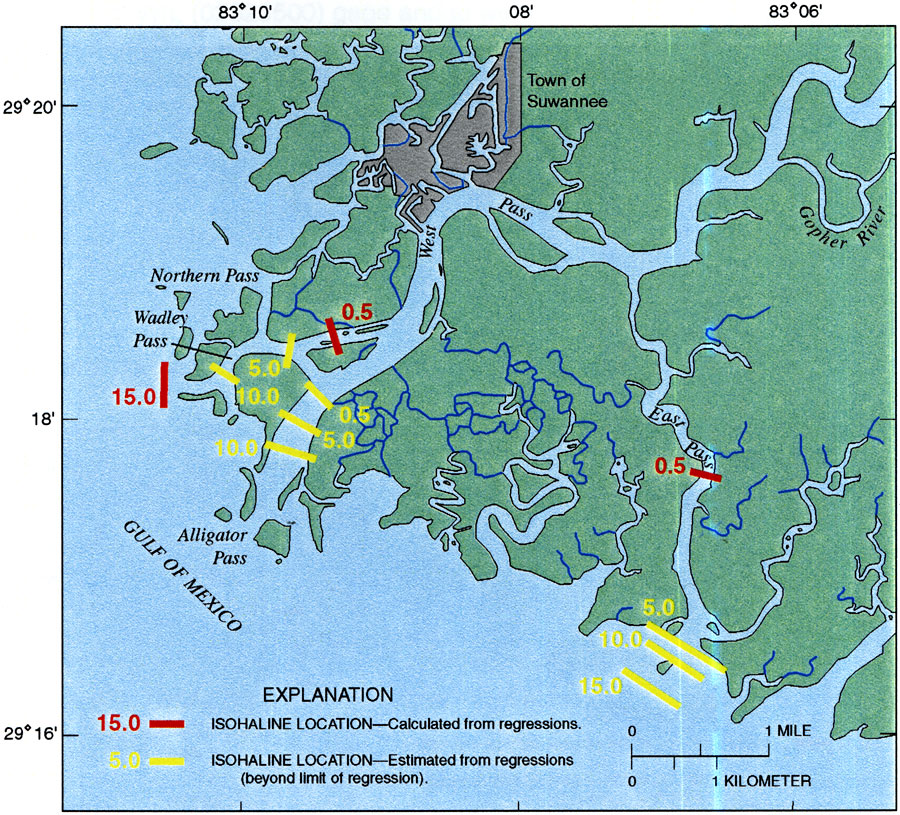
Description: This map from the U. S. Geological Survey Water Resources Investigation Report number 99-4268 shows vertically averaged salinity distribution in the upper Suwannee River Estuary near Suwannee, Florida, under high-flow conditions. Regression analyses showed that salinity concentrations measured in parts per thousand, or ppt, tended to be inversely proportional to the daily mean discharge of the river. These regressions were used to predict the maximum longitudinal extent of isohalines under high-flow conditions. Isohaline locations shown in red were calculated from the regressions, whereas locations shown in yellow were estimated. The isohalines range from 0.5 ppt to 15 ppt.
Source: Gina M. Tillis, USGS Water Resources Investigations Report 99-4268 (Tallahassee, FL: U. S. Geological Survey, 2000) 27
Map Credit: Courtesy the University of South Florida Library |
|