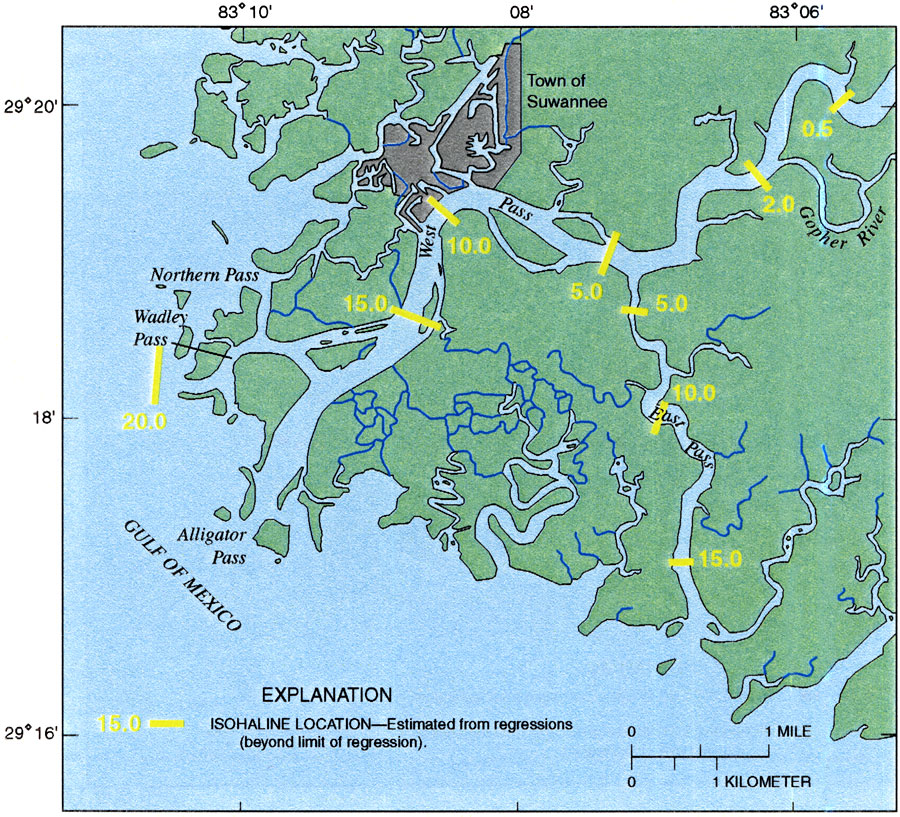
Description: This map from the U. S. Geological Survey Water Resources Investigation Report number 99-4268 shows vertically averaged salinity distribution in the upper Suwannee River Estuary near Suwannee, Florida, estimated for a 1,000 cubic feet per second withdrawal scenario under low-flow conditions. Regression analyses of salinity concentrations measured in parts per thousand, or ppt, were used to show the effects on the freshwater/saltwater interface movement of the altered the daily mean discharge of the river. These regressions were used to predict the maximum longitudinal extent of isohalines under low-flow conditions. Isohaline locations shown in red were calculated from the regressions, whereas locations shown in yellow were estimated. The isohalines range from 0.5 ppt to 15 ppt.
Source: Gina M. Tillis, USGS Water Resources Investigations Report 99-4268 (Tallahassee, FL: U. S. Geological Survey, 2000) 34
Map Credit: Courtesy the University of South Florida Library |
|