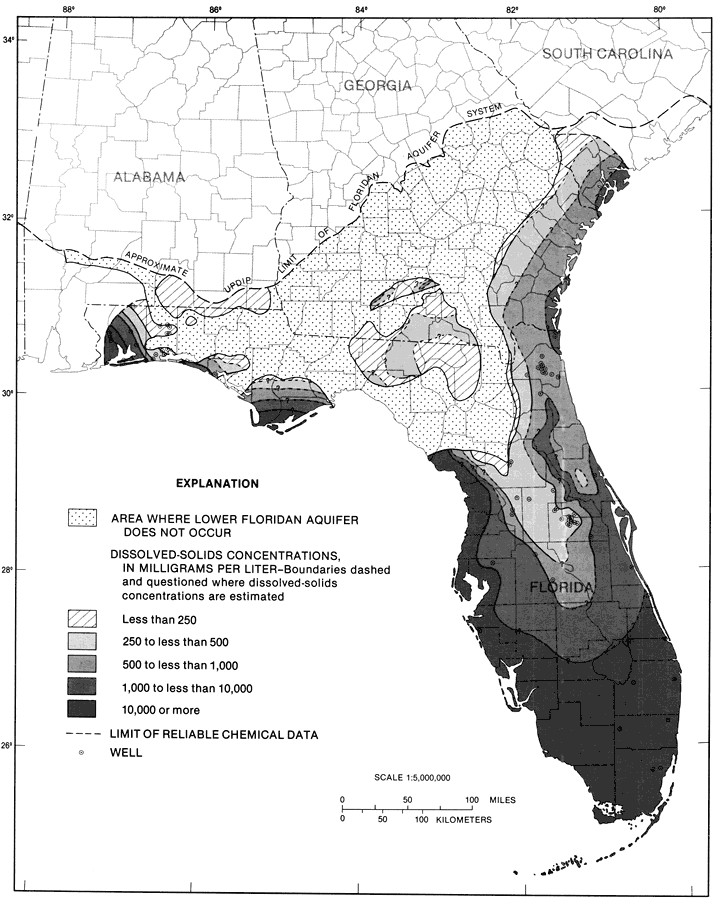
Description: This map from the U. S. Geological Survey Professional Paper 1403-1 shows the dissolved-solids concentrations in milligrams per liter in water from the Lower Floridan aquifer, current to 1989. The dotted area shows where the lower Floridan aquifer does not occur. The diagonals show less than 250 mg/l, the light shaded area is 250 to less than 500 mg/l, the medium shaded area is 500 to less than 1,000 mg/l, the medium-dark shaded area is 1,000 to less than 10,000 mg/l and the dark shaded area is 10,000 mg/l or more.
Place Names: 1950-1999, counties
ISO Topic Categories: boundaries, geoscientificInformation
Keywords: Dissolved-Solids Concentrations from the Lower Floridan Aquifer Fig 27, physical, hydrological, kFloridan aquifer, political, khydrological, geological, county borders, boundaries, geoscientificInformation, Unknown,1989
Source: Craig L. Sprinkle, USGS Professional Paper 1403-1 (Washington, : U. S. Government Printing Office, 1989) 157
Map Credit: Courtesy the University of South Florida Library |
|