mapsExploring Florida
 FL Maps > Region > 1950-1999 > Phosphorus Concentrations in South Florida, 1984 to 1993
Site Map 

Phosphorus Concentrations in South Florida, 1984 to 1993


Puzzle Directions: Click on a puzzle piece and drag it where you want it. When you connect two pieces correctly, they will join together. Mix up the pieces again. View finished map in pop-up window.

Title: Phosphorus Concentrations in South Florida
Projection: Albers_Conical_Equal
Source Bounding Coordinates:
W: -83.15 E: -79.45 N: 29 S: 24

Back to Map Page
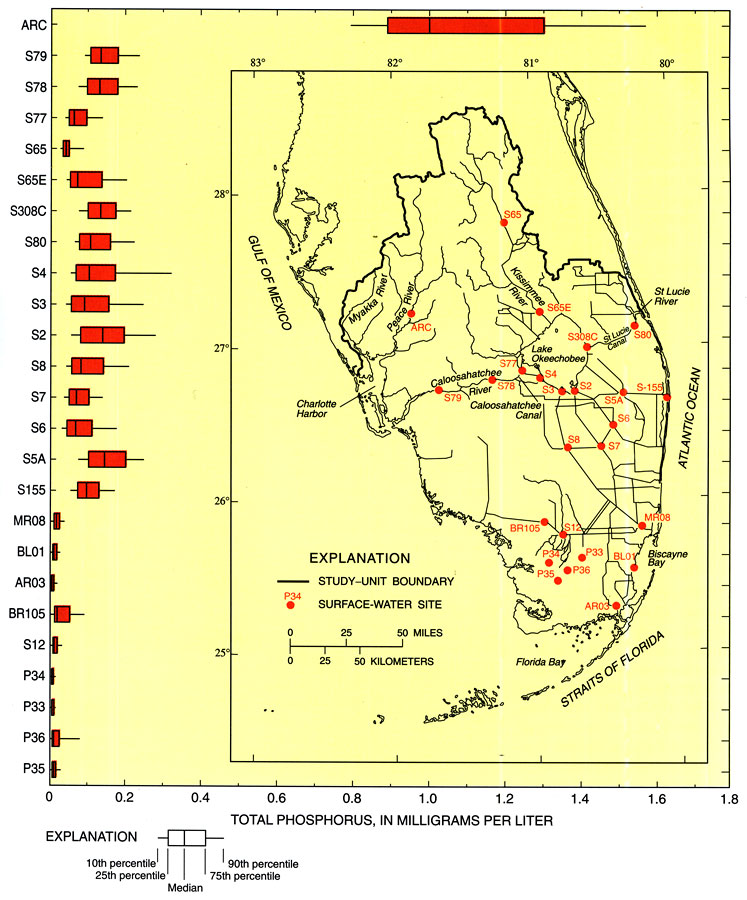
Description: This map from the U. S. Geological Survey Circular 1134, The South Florida Environment, shows the total phosphorus concentrations in water at selected sites in south Florida, based on data from South Florida Water Management District and USGS during the period 1984 to 1993. The selected sites show total phosphorus concentrations in milligrams per liter, with the data displayed in box-and-whisker format.
Source: B. F. McPherson and R. Halley, USGS Circular 1134 (Washington, DC: U. S. Government Printing Office, 1996) 43
Map Credit: Courtesy the University of South Florida Library
SearchLicensePDF HelpGIS Help Google Earth Help Zoomify Help

 FL Maps > Region > 1950-1999 > Phosphorus Concentrations in South Florida, 1984 to 1993