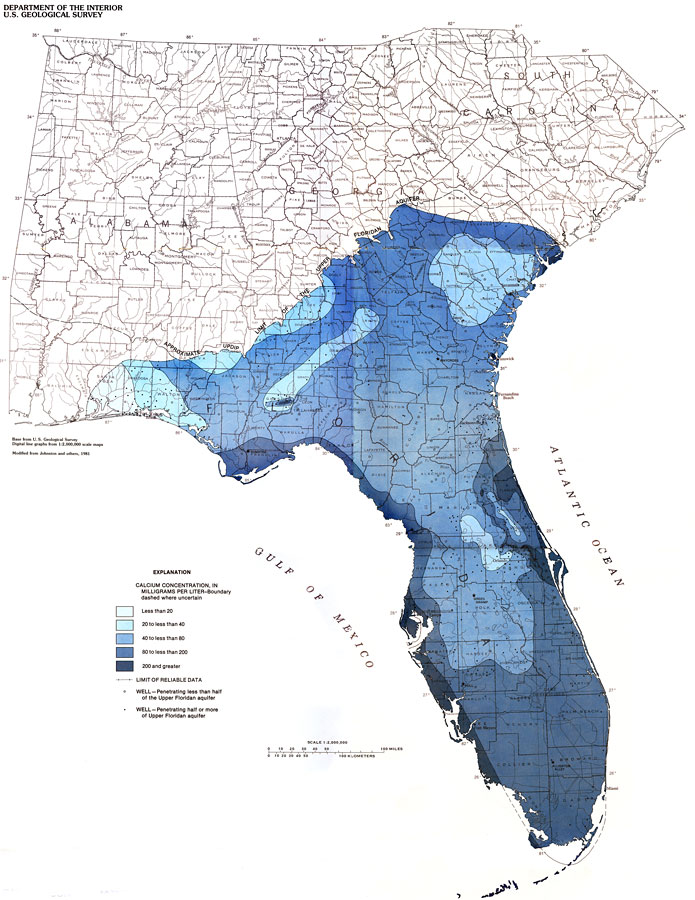
Description: This map from the U. S. Geological Survey Professional Paper 1403-1 shows the calcium concentration in milligrams per liter in water from the Upper Floridan aquifer, current to 1989. The light blue is less than 20 mg/l, the light-medium blue is 20 to less than 40 mg/l, the medium blue is 40 to less than 80 mg/l, the medium-dark blue is 80 to less than 200 mg/l and the dark blue is 200 and greater mg/l. The open circles are wells penetrating less than half of the Upper Floridan aquifer and the dots are wells penetrating half or more of the Upper Floridan aquifer.
Place Names: 1950-1999, counties, Miami, Hull, Lake Okeechobee, Tampa, Green Swamp, Inglis, Orlando, Fernandina Beach, Sumatra, Alligator Alley, Fort Walton Beach, Gulf of Mexico, Atlantic Ocean
ISO Topic Categories: boundaries, geoscientificInformation, inlandWaters, oceans
Keywords: Calcium Concentration in Water from the Upper Floridan Aquifer Plate 1, physical, hydrological, kFloridan aquifer, khydrological, political, geological, county borders, boundaries, geoscientificInformation, inlandWaters, oceans, Unknown,1989
Source: Craig L. Sprinkle, USGS Professional Paper 1403-1 (Washington, : U. S. Government Printing Office, 1989)
Map Credit: Courtesy the University of South Florida Library |
|