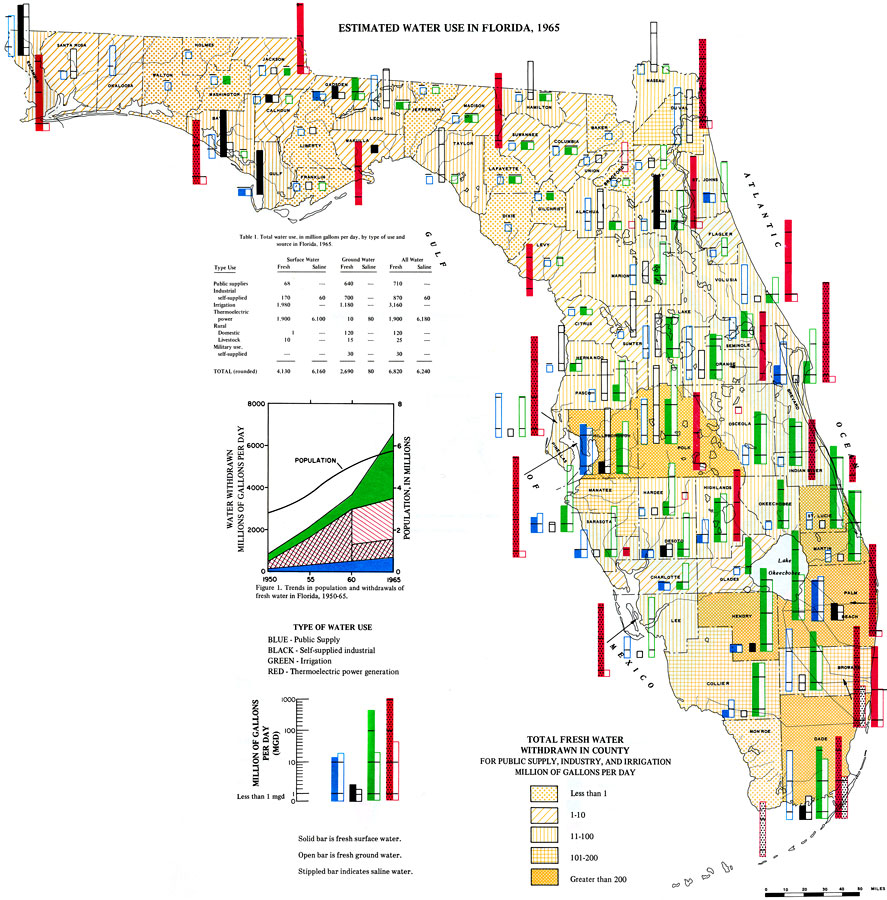
Description: This is a map showing the estimated water use in Florida, current to 1975. There is a table that shows the total water use, in million gallons per day, by type of use and source in Florida, 1965. There are two graphs along with the main map. One graph shows the trends in population and withdrawals of fresh water from 1950 to 1965. The other graph shows the amount of gallons (in millions) per day of different types of water including fresh surface water, fresh ground water and saline (salt) water. Please see the article Estimated Water Use in Florida by R. W. Pride for more information.
Place Names: 1950-1999, Counties, Hillsborough, Gulf of Mexico, Lake Okeechobee, Orange
ISO Topic Categories: boundaries, geoscientificInformation, environment, inlandWaters, oceans
Keywords: Estimated Water Use in Florida, physical, hydrological, boundaries, geoscientificInformation, environment, inlandWaters, oceans, Unknown,1975
Source: U. S. Geological Survey, Bureau of Geology, Florida Department of Natural Resources , Florida Water Atlas (Tallahassee, FL: Bureau of Geology, 1976)
Map Credit: Courtesy the University of South Florida Library |
|