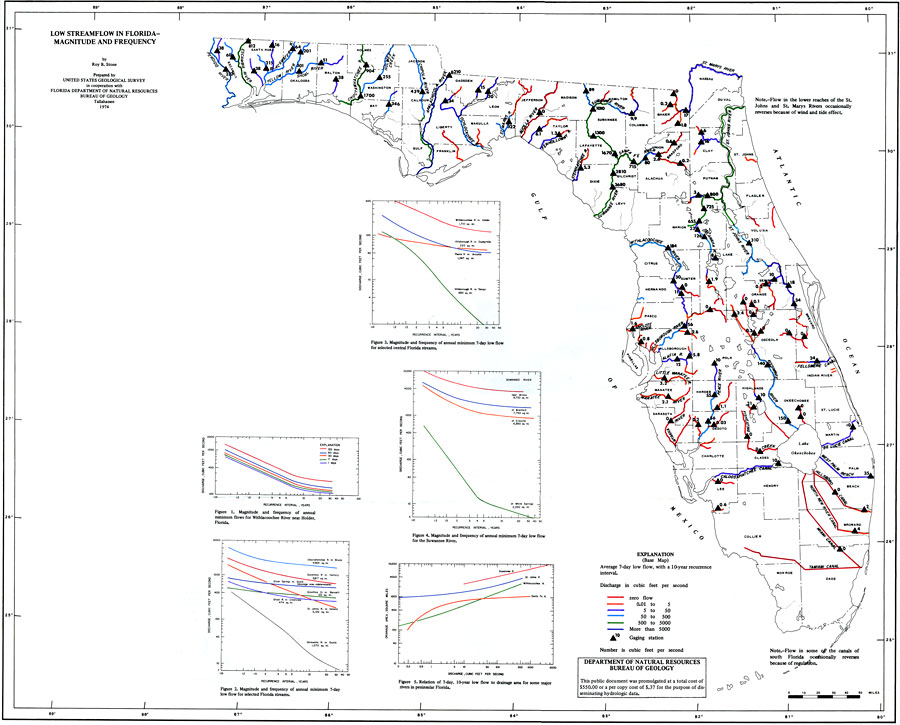
Description: This is a map showing the low streamflow in Florida with magnitude and frequency, current to 1974. The following is taken from the article "Low Streamflow in Florida- Magnitude and Frequency" by Roy B. Stone — "Streamflow in Florida fluctuates and at times is not sufficient to supply the water required for municipal or industrial supplies, supplemental irrigation, maintenance of suitable condition for fish, and disposal of liquid wastes." The key shows the average 7-day low flow, with a 10-year recurrence interval and the discharge is shown in cubic feet per second or cfs. Red is zero flow, orange is 0.01 to 5, purple is 5 to 50, blue is 50 to 500, green is 500 to 5,000 and dark blue is more than 5,000. The black triangles are gauging stations. Please see the article Low Streamflow in Florida- Magnitude and Frequency by Roy B. Stone for more information.
Source: U. S. Geological Survey, Bureau of Geology, Florida Department of Natural Resources , Florida Water Atlas (Tallahassee, FL: Bureau of Geology, 1976)
Map Credit: Courtesy the University of South Florida Library |
|