mapsExploring Florida
 FL Maps > State > 2000- > Nitrogen in Southeast, 2000
Site Map 

Nitrogen in Southeast, 2000


Puzzle Directions: Click on a puzzle piece and drag it where you want it. When you connect two pieces correctly, they will join together. Mix up the pieces again. View finished map in pop-up window.

Title: Nitrogen in Southeast
Projection: Unknown
Source Bounding Coordinates:
W: E: N: S:

Back to Map Page
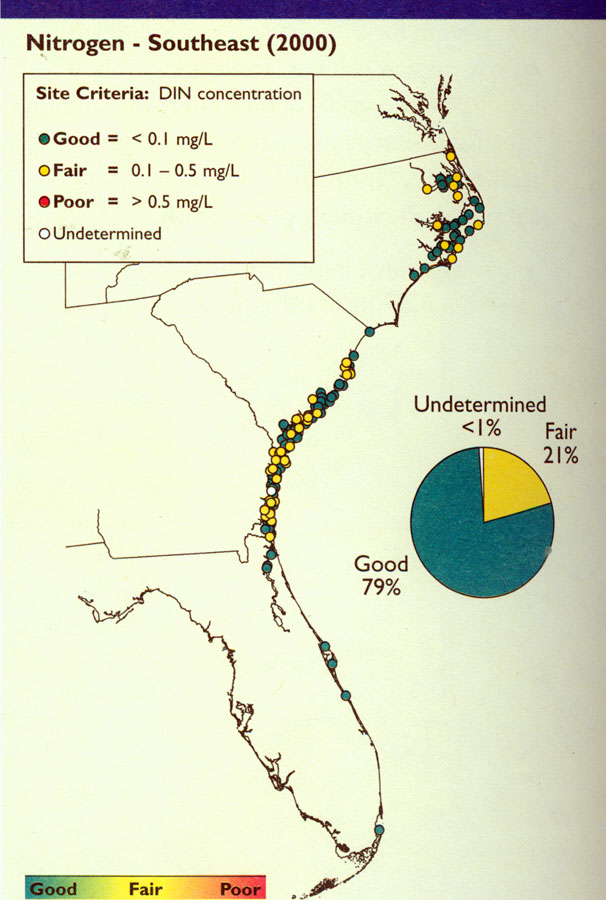
Description: Map shows DIN concentration data for Southeast Coast estuaries in 2000 C.E. Levels of nitrogen range from good to poor, with good being less than 0.1 mg/L DIN concentration and poor being more than 0.5 mg/L DIN concentration.
Source: , National Coastal Condition Report II (Washington, DC: Environmental Protection Agency, 2004) 114
Map Credit: Courtesy the private collection of Roy Winkelman
SearchLicensePDF HelpGIS Help Google Earth Help Zoomify Help

 FL Maps > State > 2000- > Nitrogen in Southeast, 2000