|
|
|
| FL Maps > State > 1950-1999 |
|
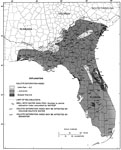
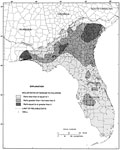
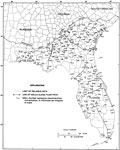
Calcite Saturation Index from the Upper Floridan Aquifer Fig 16,
1989 |
|
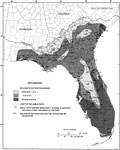
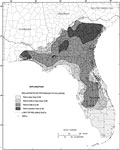
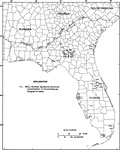
Dolomite Saturation Index from the Upper Floridan Aquifer Fig 18,
1989 |
|
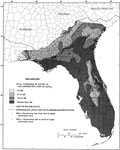
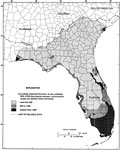
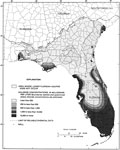
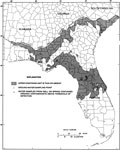
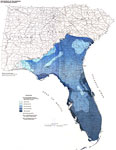
Total Hardness of Water from the Upper Floridan Aquifer Fig 19,
1989 |
|
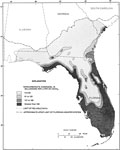
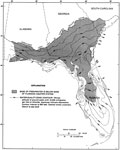
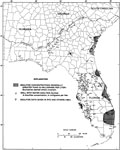
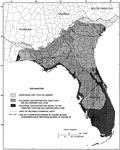
Noncarbonate Hardness of Water from the Upper Floridan Aquifer Fig 20,
1989 |
|
Sodium-to-chloride Molar Ratios in the Upper Floridan Aquifer Fig 21A,
1989 |
|
Potassium-to-chloride Molar Ratios in the Upper Floridan Aquifer Fig 21B,
1989 |
|
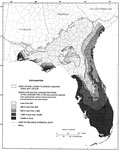
Chloride Concentrations from the Upper 200 ft of the Floridan Aquifer Fig 22,
1989 |
|
Altitude of the Estimated Base of Freshwater Flow Fig 23,
1989 |
|
Chloride Concentrations from the Lower Floridan Aquifer Fig 24,
1989 |
|
Bisulfide Concentrations in the Upper Floridan Aquifer Fig 26,
1989 |
|
Dissolved-Solids Concentrations from the Lower Floridan Aquifer Fig 27,
1989 |
|
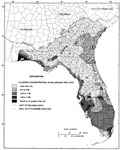
Fluoride Concentrations from the Upper Floridan Aquifer Fig 28,
1989 |
|
Concentrations of Dissolved Silica from the Upper Floridan Aquifer Fig 30,
1989 |
|
Concentrations of Aluminum from the Upper Floridan Aquifer Fig 32,
1989 |
|
Wells and Springs in the Upper Floridan Aquifer Fig 37,
1989 |
|
Relation of Chloride Concentrations to Confined-Unconfined Conditions Fig 38,
1989 |
|
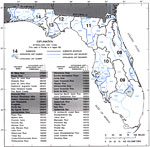
Calcium Concentration in Water from the Upper Floridan Aquifer Plate 1,
1989 |
|
Land Cover Characteristics,
1992-1993 |
|
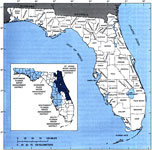
Counties and Water Management Districts in Florida,
1995 |
|
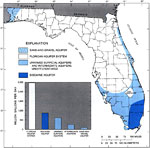
Extent of Principal Aquifers in Florida,
1995 |
|
Hydrologic Unit Codes in Florida,
1995 |
|
Florida - Metropolitan Areas, Counties, and Central Cities,
1999 |
|
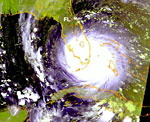
Hurricane Andrew,
August 24, 1992 |
|
Hurricane Andrew,
August 24, 1992 |
|
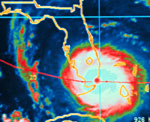
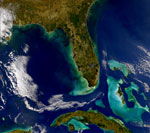
Florida, Cuba and the Bahamas,
February 25, 1998 |
| First | Previous | Next | Last |
| FL Maps > State > 1950-1999 |
Maps ETC
is a part of the
Educational Technology Clearinghouse
Produced by the
Florida Center for Instructional Technology
© 2007
College of Education
,
University of South Florida