|
|
|
| FL Maps > State > 1950-1999 |
|
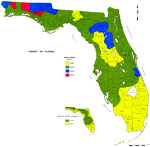
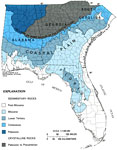
Runoff in Florida,
1976 |
|
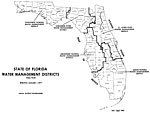
State of Florida Water Management Districts,
1977 |
|
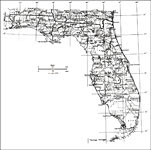
General Map of Florida,
1978 |
|
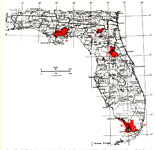
National Forests, Everglades National Park, and Biscayne National Monument,
1978 |
|
Plant Hardiness Zones,
1978 |
|
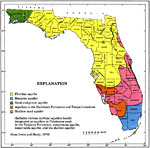
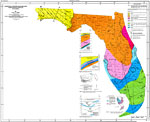
Florida Aquifers,
1978 |
|
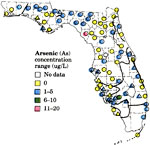
Quality of Untreated Water for Public Supplies in Florida- Arsenic,
1979 |
|
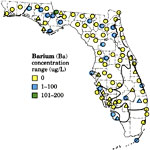
Quality of Untreated Water for Public Supplies in Florida- Barium,
1979 |
|
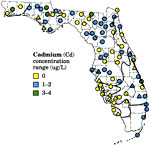
Quality of Untreated Water for Public Supplies in Florida- Cadmium,
1979 |
|
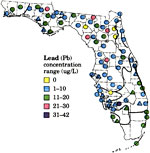
Quality of Untreated Water for Public Supplies in Florida- Lead,
1979 |
|
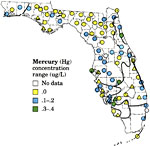
Quality of Untreated Water for Public Supplies in Florida- Mercury,
1979 |
|
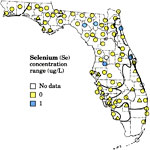
Quality of Untreated Water for Public Supplies in Florida- Selenium,
1979 |
|
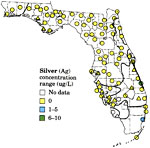
Quality of Untreated Water for Public Supplies in Florida- Silver,
1979 |
|
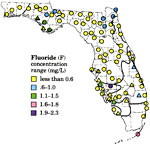
Quality of Untreated Water for Public Supplies in Florida- Fluoride,
1979 |
|
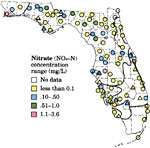
Quality of Untreated Water for Public Supplies in Florida- Nitrate,
1979 |
|
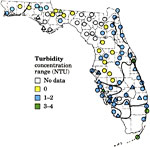
Quality of Untreated Water for Public Supplies in Florida- Turbidity,
1979 |
|
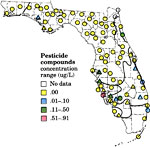
Quality of Untreated Water for Public Supplies in Florida- Pesticide Compounds,
1979 |
|
Potential Subsurface Zones for Liquid Waste Storage in Florida,
1979 |
|
Water Quality of Florida Springs,
1979 |
|
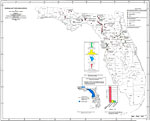
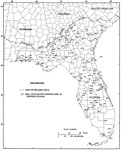
Sources of Water Supplying Simulated 1980 Pumpage from the Floridan Aquifer,
1988 |
|
Generalized Geologic Map of the Southeastern United States,
1988 |
|
Decline of Potentiometric Surface of the Floridan Aquifer,
1988 |
|
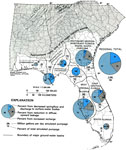
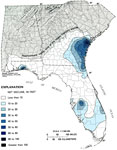
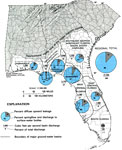
Estimated Predevelopment Discharge of the Upper Floridan Aquifer,
1988 |
|
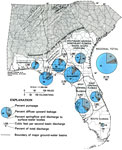
Estimated 1980 Discharge of the Upper Floridan Aquifer,
1988 |
|
Temperatures from the Upper Floridan Aquifer Fig 2,
1989 |
| First | Previous | Next | Last |
| FL Maps > State > 1950-1999 |
Maps ETC
is a part of the
Educational Technology Clearinghouse
Produced by the
Florida Center for Instructional Technology
© 2007
College of Education
,
University of South Florida