|
|
|
| FL Maps > Region > 1950-1999 |
|
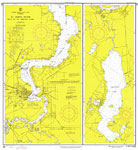
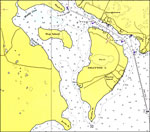
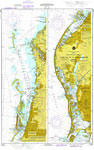
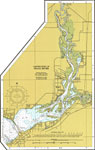
St. Johns River: Racy Point to Crescent Lake,
1970 |
|
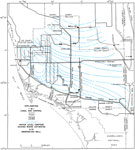
The Shallow Aquifer of Southwest Florida- Low Water-Level Contours,
1971 |
|
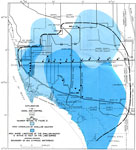
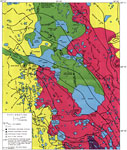
The Shallow Aquifer of Southwest Florida- Approximate Areal Extent,
1972 |
|
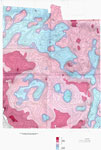
Bouguer Anomaly Map of the Florida Peninsula and Adjoining Continental Shelves,
1972 |
|
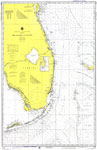
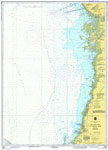
Cape Canaveral to Key West,
1974 |
|
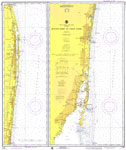
Jupiter Inlet to Fowey Rocks,
1974 |
|
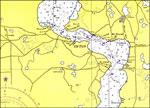
Hydrology of the Oklawaha Lakes Area of Florida- Figure 1,
1974 |
|
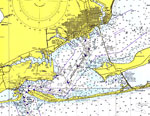
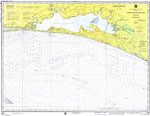
Pensacola Bay and Approaches,
1975 |
|
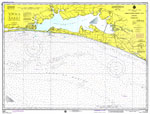
Chocktawhatchee Bay,
1975 |
|
Chocktawhatchee Bay,
1975 |
|
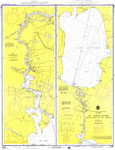
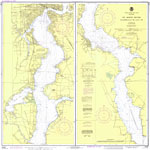
St. Johns River: Dunns Creek to Lake Dexter,
1976 |
|
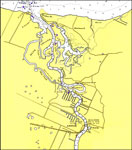
St. Johns River: Astor,
1976 |
|
St. Johns River: Drayton,
1976 |
|
St. Johns River: Norwalk,
1976 |
|
St. Johns River: Wakela,
1976 |
|
Anclote Keys to Crystal River,
1977 |
|
Intercoastal Waterway: Tampa Bay to Anclote Anchorage,
1977 |
|
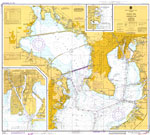
Tampa Bay Northern Part,
1977 |
|
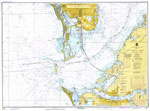
Tampa Bay Southern Part,
1977 |
|
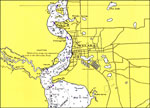
St. Johns River: Jacksonville to Racy Point,
1977 |
|
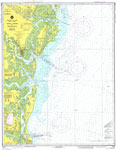
Doboy Sound to Fernandina,
1977 |
|
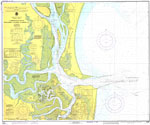
Cumberland Sound: Fernandina Harbor to Kings Bay,
1977 |
|
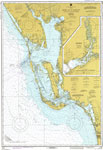
Estero Bay to Lemon Bay, Including Charlotte Harbor,
1977 |
|
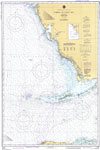
Habana to Tampa Bay,
1977 |
|
Continuation of Peace River,
1977 |
| First | Previous | Next | Last |
| FL Maps > Region > 1950-1999 |
Maps ETC
is a part of the
Educational Technology Clearinghouse
Produced by the
Florida Center for Instructional Technology
© 2007
College of Education
,
University of South Florida