|
|
|
| FL Maps > Region > 1950-1999 |
|
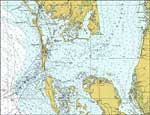
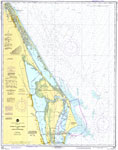
Lower Charlotte Harbor,
1977 |
|
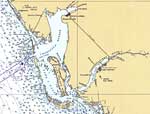
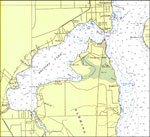
Charlotte Harbor,
1977 |
|
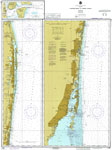
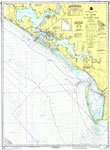
Jupiter Inlet to Fowey Rocks,
1977 |
|
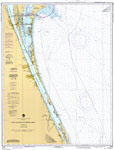
Cape Canaveral to Bethel Shoal,
1977 |
|
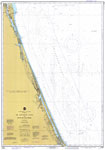
Ponce De Leon Inlet to Cape Canaveral,
1977 |
|
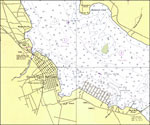
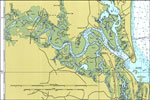
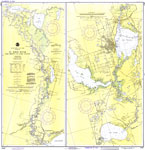
St. Johns River: Doctors Lake,
1977 |
|
St. Johns River: Green Cove Springs,
1977 |
|
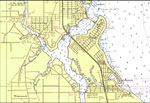
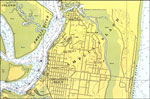
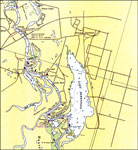
St. Johns River: Ortega,
1977 |
|
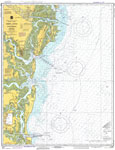
Amelia Island to St. Augustine,
1977 |
|
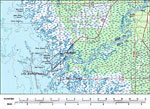
Nassau River,
1977 |
|
Cumberland Sound: Fernandina Beach,
1977 |
|
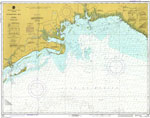
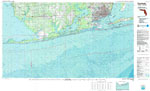
St. Joseph and St. Andrew Bays,
1977 |
|
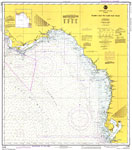
Tampa Bay to Cape San Blas,
1977 |
|
Apalachee Bay,
1977 |
|
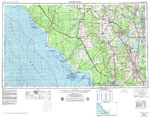
Gainesville,
1978 |
|
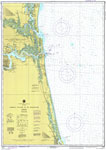
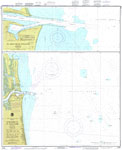
Approaches to St. Johns River,
1978 |
|
Cedar Keys,
1978 |
|
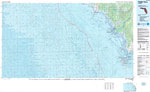
Fort Walton Beach,
1978 |
|
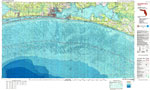
Pensacola,
1978 |
|
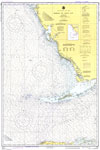
Habana to Tampa Bay,
1978 |
|
St. Augustine Light to Ponce De Leon Inlet,
1978 |
|
Suwannee River Area,
1978 |
|
St. Johns River: Lake Dexter to Lake Harney,
1979 |
|
Doboy Sound to Fernandina,
1979 |
|
St. Johns River: Lake Beresford,
1979 |
| First | Previous | Next | Last |
| FL Maps > Region > 1950-1999 |
Maps ETC
is a part of the
Educational Technology Clearinghouse
Produced by the
Florida Center for Instructional Technology
© 2007
College of Education
,
University of South Florida