|
|
|
| FL Maps > Region > 1950-1999 |
|
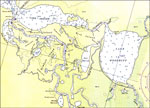
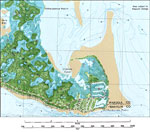
St. Johns River: Lake Dexter and Lake Woodruff,
1979 |
|
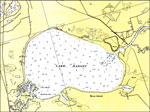
St. Johns River: Lake Harney,
1979 |
|
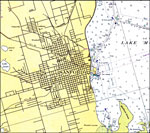
St. Johns River: Sanford,
1979 |
|
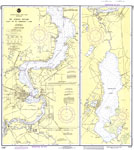
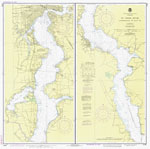
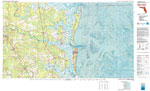
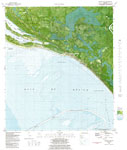
St. Johns River: Racy Point to Crescent Lake,
1980 |
|
St. Johns River: Jacksonville to Racy Point,
1980 |
|
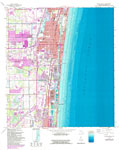
Jacksonville,
1980 |
|
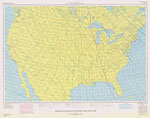
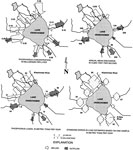
Magnetic Declination In The United States - Epoch 1980,
1980 |
|
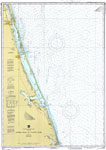
Bethel Shoal to Jupiter Inlet,
1980 |
|
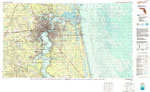
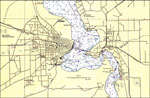
St. Johns River: Palatka,
1980 |
|
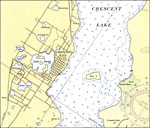
St. Johns River: Crescent City,
1980 |
|
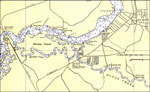
St. Johns River: Murphy Island and San Mateo,
1980 |
|
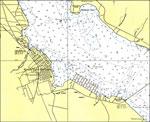
St. Johns River: Green Cove Springs,
1980 |
|
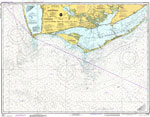
Apalachicola Bay to Cape San Blas,
1980 |
|
Average Discharge from Major Canals in South Florida,
1980 to 1989 |
|
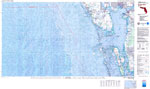
Charlotte Harbor,
1981 |
|
Fernandina Beach,
1981 |
|
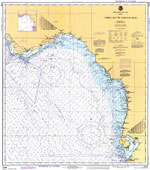
Tampa Bay to Cape San Blas,
1981 |
|
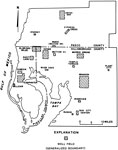
Well Fields of Tampa Bay Area,
1981 |
|
Lighthouse Point,
1982 |
|
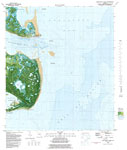
Indian Pass,
1982 |
|
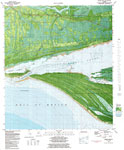
Beacon Hill,
1982 |
|
Mashes Island,
1982 |
|
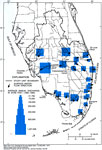
Spatial Distribution of Phosphorus Concentrations, Discharge, Loads, and Standard Error in Load Estimates for Lake Okeechobee,
1982 to 1991 |
|
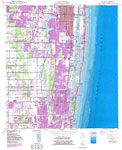
Delray Beach Quadrangle,
1983 |
|
Lake Worth Quadrangle,
1983 |
| First | Previous | Next | Last |
| FL Maps > Region > 1950-1999 |
Maps ETC
is a part of the
Educational Technology Clearinghouse
Produced by the
Florida Center for Instructional Technology
© 2007
College of Education
,
University of South Florida