|
|
|
| FL Maps > Region > 1950-1999 |
|
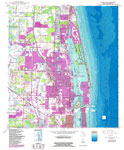
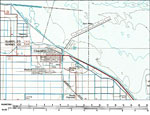
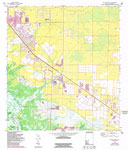
Riviera Beach Quadrangle,
1983 |
|
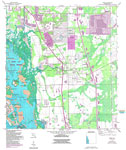
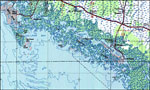
Jupiter, FL,
1983 |
|
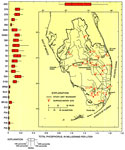
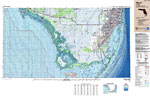
Phosphorus Concentrations in South Florida,
1984 to 1993 |
|
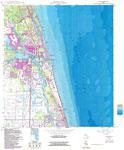
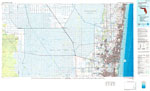
West Palm Beach Quadrangle,
1985 |
|
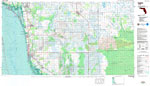
Naples Quadrangle,
1985 |
|
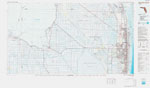
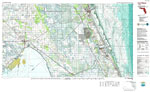
Vero Beach Quadrangle,
1985 |
|
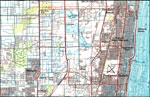
Fort Lauderdale, Florida,
1985 |
|
Pompano Beach, Florida,
1985 |
|
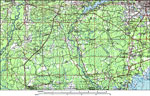
Clewiston,
1985 |
|
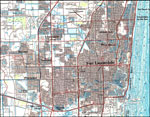
Fort Lauderdale Area,
1985 |
|
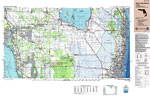
Fort Pierce Quadrangle,
1986 |
|
West Palm Beach to Naples,
1987 |
|
Belle Meade Quadrangle,
1987 |
|
Bonita Springs Quadrangle,
1987 |
|
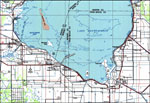
South Lake Okeechobee,
1987 |
|
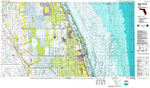
Miami Area Topographic-Bathymetric Map,
1988 |
|
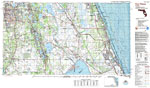
Fort Pierce Quadrangle,
1988 |
|
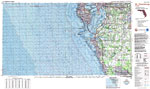
St. Petersburg Quadrangle,
1988 |
|
Jacksonville,
1988 |
|
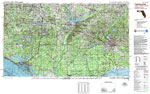
Tallahassee,
1988 |
|
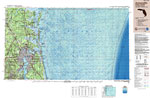
Ten Thousand Islands, Florida,
1988 |
|
Apalachicola National Forest,
1988 |
|
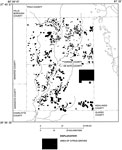
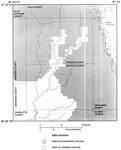
Generalized Location of Citrus Groves in Hardee and De Soto Counties,
1988 |
|
Altitude of Water Table in Hardee and De Soto Counties,
1988 |
|
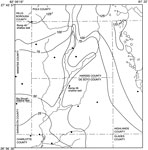
Areas of Leakage through the Upper Confining Unit in Hardee and De Soto Counties,
1988 |
| First | Previous | Next | Last |
| FL Maps > Region > 1950-1999 |
Maps ETC
is a part of the
Educational Technology Clearinghouse
Produced by the
Florida Center for Instructional Technology
© 2007
College of Education
,
University of South Florida