|
|
|
| FL Maps > Region > 1950-1999 |
|
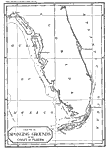
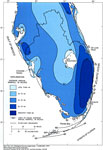
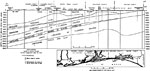
Sponging Grounds of the Coast of Florida,
1922 |
|
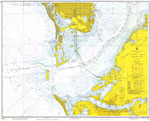
Tampa, Florida,
1950 |
|
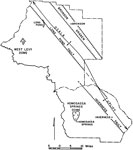
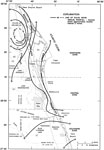
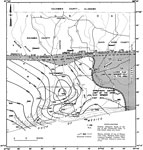
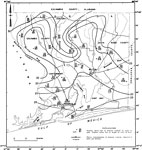
Principal Geologic Structures in Citrus and Levy Counties,
1951 |
|
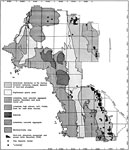
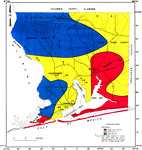
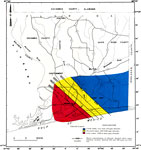
Distribution of the Economic Deposits of Citrus and Levy Counties,
1951 |
|
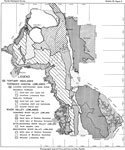
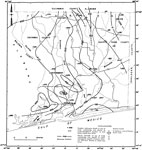
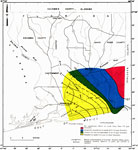
Physiographic Map of Citrus and Levy Counties,
1951 |
|
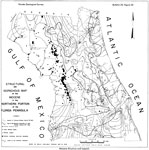
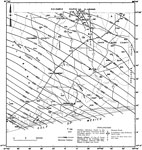
Fracture Pattern of the Northern Portion of the Florida Peninsula,
1951 |
|
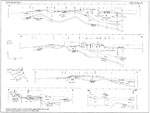
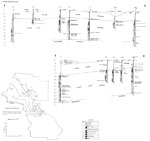
Geologic Sections Crossing the Northern Portion of the Florida Peninsula,
1951 |
|
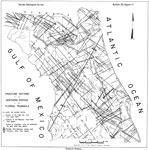
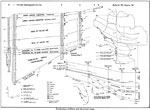
Geologic Section along the Proposed Florida Ship Canal,
1951 |
|
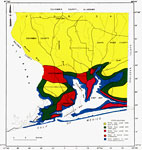
Cretaceous Sections and Structural Map,
1951 |
|
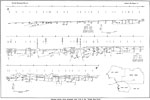
Geologic Sections through the Lake City Limestone in Citrus and Levy Counties,
1951 |
|
Structural an Isopachous Map of the Miocene in the Northern Portion of the Florida Peninsula,
1951 |
|
Mean Annual Rainfall in the Indian River Basin,
1951 to 1980 |
|
Annual Rainfall in South Florida,
1951 to 1980 |
|
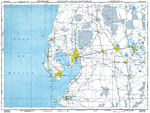
San Carlos Bay and Caloosahatchee River,
1959 |
|
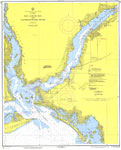
Tampa Bay: North,
1961 |
|
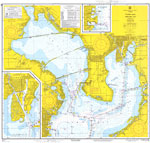
Tampa Bay, Southern Part,
1966 |
|
Ground-Water Features in Escambia and Santa Rosa Counties, Florida- Figure 6,
1967 |
|
Ground-Water Features in Escambia and Santa Rosa Counties, Florida- Figure 7,
1967 |
|
Ground-Water Features in Escambia and Santa Rosa Counties, Florida- Figure 8,
1967 |
|
Ground-Water Features in Escambia and Santa Rosa Counties, Florida- Figure 9,
1967 |
|
Ground-Water Features in Escambia and Santa Rosa Counties, Florida- Figure 12,
1967 |
|
Ground-Water Features in Escambia and Santa Rosa Counties, Florida- Figure 13,
1967 |
|
Ground-Water Features in Escambia and Santa Rosa Counties, Florida- Figure 14,
1967 |
|
Ground-Water Features in Escambia and Santa Rosa Counties, Florida- Figure 15,
1967 |
|
Ground-Water Features in Escambia and Santa Rosa Counties, Florida- Figure 3,
1967 |
| Next | Last |
| FL Maps > Region > 1950-1999 |
Maps ETC
is a part of the
Educational Technology Clearinghouse
Produced by the
Florida Center for Instructional Technology
© 2007
College of Education
,
University of South Florida