Maps Site map
  FL Maps > Region > 1950-1999
Site Map  

  Record   226   to   250  of   261

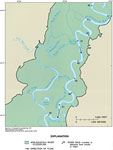
Lake Iamonia Intensive Study Area, 1998
This map from the U. S. Geological Survey Professional Paper number 1594, Aquatic Habitats in Relation to River Flow in the Apalachicola River Floodplain, shows the Apalachicola River floodplain of the Iamonia Lake intensive study area between Calhou...

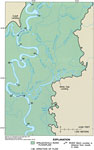
River Styx Intensive Study Area, 1998
This map from the U. S. Geological Survey Professional Paper number 1594, Aquatic Habitats in Relation to River Flow in the Apalachicola River Floodplain, shows the Apalachicola River floodplain of the River Styx intensive study area between Gulf and...

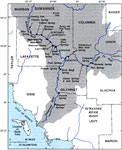
Springs of the Lower Suwannee River Basin, 1999
This map from the U. S. Geological Survey Water Resources Investigation Report number 99-4252, Source and Chronology of Nitrate Contamination in Spring Waters, Suwannee River Basin, shows the location of major springs and well sites used in the study...

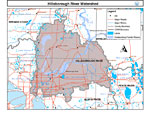
Hillsborough River Watershed, 2000
This is a map from the Southwest Florida Watershed Management District or SWFWMD of the Hillsborough River watershed. This map shows the Comprehensive Watershed Management or CWM boundary shown by the thick gray line and outstanding Florida waters hi...

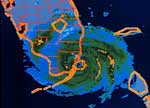
Hurricane Andrew in Dade County, August 24, 1992
This is an infrared image of Hurricane Andrew making landfall in Dade County at 0900 UTC August 24, 1992....

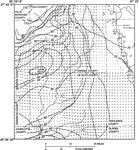
Groundwater Movement in the Intermediate Aquifer System in Hardee and De Soto Counties, May 1989
This map from the U. S. Geological Survey Water Resources Investigation Report number 93-4158, Hydrology and Simulated Effects of Groundwater Withdrawals for Citrus Irrigation, Hardee and De Soto Counties, shows the interpolated and simulated potenti...

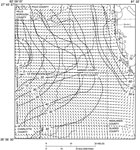
Groundwater Movement in the Upper Floridan Aquifer System in Hardee and De Soto Counties, May 1989
This map from the U. S. Geological Survey Water Resources Investigation Report number 93-4158, Hydrology and Simulated Effects of Groundwater Withdrawals for Citrus Irrigation, Hardee and De Soto Counties, shows the interpolated and simulated potenti...

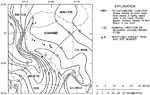
Potentiometric Contours and Direction of Groundwater Flow in the Suwannee River Water Management District, May 1990
This map from the U. S. Geological Survey Water Resources Investigation Report number 95-4064, Effects of Waste-Disposal Practices on Ground-Water Quality at Five Poultry Farms in North-Central Florida, shows the potentiometric-surface contours, in 1...

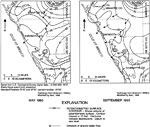
Composite Potentiometric Surface of the Intermediate Aquifer System in Southwest Florida, May and September 1993
These maps from the U. S. Geological Survey Water Resources Investigation Report number 96-4063, Hydrology of the Surficial and Intermediate Aquifer Systems in Sarasota and Adjacent Counties, show the altitude of potentiometric surface and direction ...

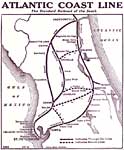
Atlantic Coast Line, mid 1900s
This map of Florida shows railroad lines for the Atlantic Coast Line: the Standard Railroad of the South, current to the mid-1900s. Routes from Jacksonville to Tampa are indicated. The dashes lines represent branch lines, while the solid ones indicat...

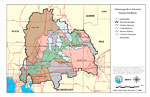
Hillsborough River Watershed General Location Information- Map 1, November 10, 1999
This is a map from the Southwest Florida Watershed Management District or SWFWMD of the Hillsborough River watershed general location information created on November 10, 1999. This map shows the Watershed Management boundary shown by the thick black ...

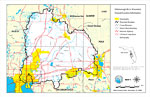
Hillsborough River Watershed Distribution of Conservation Lands- Map 15, November 10, 1999
This is a map from the Southwest Florida Watershed Management District or SWFWMD of the Hillsborough River watershed distribution of conservation lands, created on November 10, 1999. The following ownership classifications are shown by color: Federal...

Hillsborough River Watershed Drainage Sub Basins- Map 5, November 12, 1999
This is a map from the Southwest Florida Watershed Management District or SWFWMD of the Hillsborough River watershed drainage sub basins created on November 12, 1999. Each sub basin is shown with the names and separated by colors. This map shows the ...

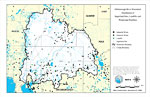
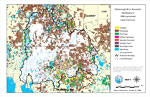
Hillsborough River Watershed Distribution of Water Management Data Base Monitoring Sites- Map 7, November 17, 1999
This is a map from the Southwest Florida Watershed Management District or SWFWMD of the Hillsborough River watershed distribution of water management data base monitoring sites created on November 17, 1999. This map shows the following: Stream Flow (...

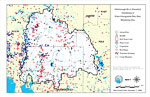
Hillsborough River Watershed Distribution of Superfund Sites, Landfills and Wastewater Facilities- Map 6, November 2, 1999
This is a map from the Southwest Florida Watershed Management District or SWFWMD of the Hillsborough River watershed distribution of superfund sites, landfills and wastewater facilities created on November 2, 1999. This map shows industrial waste (bl...

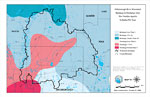
Hillsborough River Watershed Non-Point Source Loading Potential- Map 8, November 2, 1999
This is a map from the Southwest Florida Watershed Management District or SWFWMD of the Hillsborough River watershed non-point source loading potential, created on November 2, 1999. Non-point source pollution is not from industrial and sewage treatme...

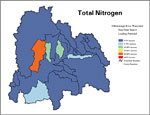
Hillsborough River Watershed Non-Point Source Loading Potential for Nitrogen, November 2, 1999
This is a detail of a map from the Southwest Florida Watershed Management District or SWFWMD of the Hillsborough River watershed non-point source loading potential showing total nitrogen only, created on November 2, 1999. Non-point source pollution i...

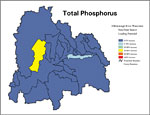
Hillsborough River Watershed Non-Point Source Loading Potential for Phosphorus, November 2, 1999
This is a detail of a map from the Southwest Florida Watershed Management District or SWFWMD of the Hillsborough River watershed non-point source loading potential showing total phosphorus only, created on November 2, 1999. Non-point source pollution...

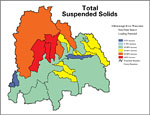
Hillsborough River Watershed Non-Point Source Loading Potential for Suspended Solids, November 2, 1999
This is a detail of a map from the Southwest Florida Watershed Management District or SWFWMD of the Hillsborough River watershed non-point source loading potential showing total suspended solids only, created on November 2, 1999. Non-point source pol...

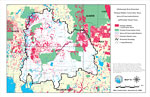
Hillsborough River Watershed Strategic Habitat Conservation Areas, Areas of Conservation Interest, and Potential Natural Areas- Map 16, November 3, 1999
This is a map from the Southwest Florida Watershed Management District or SWFWMD of the Hillsborough River watershed strategic habitat conservation area, areas of conservation interest and potential natural areas, created on November 3, 1999. The fol...

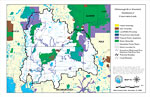
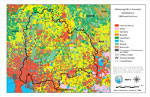
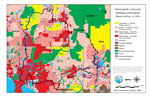
Hillsborough River Watershed Distribution of 1990 Land Use/Cover- Map 2, October 1, 1999
This is a map from the Southwest Florida Watershed Management District or SWFWMD of the Hillsborough River watershed distribution of 1990 land use/cover created on October 1, 1999. This map shows the Watershed Management boundary shown by the thick b...

Hillsborough River Watershed Distribution of Generalized Future Land Use, Ca. 2010- Map 3, October 1, 1999
This is a map from the Southwest Florida Watershed Management District or SWFWMD of the Hillsborough River watershed distribution of generalized future land use, ca. 2010 created on October 1, 1999. This map shows the Watershed Management boundary sh...

Hillsborough River Watershed Distribution of 1990 Agricultural Land Use/Cover- Map 4, October 1, 1999
This is a map from the Southwest Florida Watershed Management District or SWFWMD of the Hillsborough River watershed distribution of 1990 agricultural land use/cover created on October 1, 1999. This map shows the Watershed Management boundary shown b...

Hillsborough River Watershed Ground Water Pollution Potential to the Floridian Aquifer (D.R.A.S.T.I.C.)- Map 9, October 1, 1999
This is a map from the Southwest Florida Watershed Management District or SWFWMD of the Hillsborough River ground water pollution potential to the Floridian aquifer created on October 1, 1999. The pollution potential is shown with a composite DRASTIC...

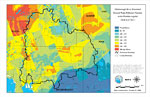
Hillsborough River Watershed Recharge to/Discharge from the Floridan Aquifer In Inches Per Year- Map 10, October 1, 1999
This is a map from the Southwest Florida Watershed Management District or SWFWMD of the Hillsborough River watershed recharge to and discharge from the Floridian aquifer in inches per year created on October 1, 1999. The recharge and discharge are sh...

First Previous Next Last


  FL Maps > Region > 1950-1999
Site Map  

Maps ETC is a part of the Educational Technology Clearinghouse
Produced by the Florida Center for Instructional Technology © 2007
College of Education , University of South Florida