
We are pleased to welcome Sister John Paul as a guest contributor! She is the principal of St. Michael School in Worthington, Ohio.
St. Michael School set out to find a framework to build a conversation around how to best integrate technology to advance student learning. After observing the use of technology over the course of a school year, an assessment identified a need to:
- have a common vocabulary of what technology integration is and a shared understanding of what it looks like in action;
- generate conversations around when and in what way technology integration best serves student learning and when it should be re-evaluated to ensure the proper space and silence for creativity, imagination, and whole child development;
- identify where educators were comfortable in using technology and where they needed professional development or different technology tools;
- provide a forum for reflection and feedback on technology use in a constructive way, outside a formal process of evaluation, that increased confidence and encouraged growth; and
- ensure that technology purchased was technology integrated with the use intended and a strategic application for student learning.
In 2016, the school chose the Technology Integration Matrix (TIM) model, developed by the Florida Center for Instructional Technology, as the framework to address needs in vocabulary, shared conversations, appropriate technology use, better coaching and improved technology investments.
The TIM Tools, especially the Technology Uses and Perception Survey (TUPS), were selected because of their multifaceted approach to collecting data that could be used to guide growth in the following areas:
- technology access and support;
- preparation for technology use;
- perceptions of technology use;
- confidence and comfort using technology;
- technology integration;
- teacher and student use of technology; and
- technology skills and usefulness.
To help implement the TIM, St. Michael selected a technology company with an education technology division, S3 Technologies. The vision behind the choice was threefold:
- to use the TIM to provide the framework to reference for growth assessment;
- to onboard technology professionals for coaching and implementing the TIM; and
- to merge the framework and professional expertise with collaboration and active strategic planning from the school leadership to ensure continuity with the school’s mission.
Seeing the big picture in the data and observation feedback from the TIM allows principals and district leaders to plan and budget for technology with more accuracy and detail to advance growth. Actively collaborating with S3 Technologies to implement the TIM provides a comprehensive solution for consultation and training that meets the variety of needs that invariably arise in school environments.
At St. Michael, the S3 Technologies’ Director of Education Technology, Tricia Dirker, was tasked with coordinating the various TIM Tools, coaching sessions with teachers using feedback from TIM-O observations, and assessing the Technology Uses and Perceptions Survey (TUPS) in conjunction with the school’s educational mission and budgeting priorities.
Working with the principal, Tricia Dirker and the S3 Technologies team provided continuity between the data and people with a ground level awareness of the relationship between devices and users. This resulted in a well-coordinated strategic planning approach that used the TIM as its foundation for solid growth.
Over the next five years, the Technology Integration Matrix re-framed the conversation with vocabulary that showed the interrelationship between the role of the teacher, the level of student activity and the characteristics of the learning environment. This provided concrete descriptions of levels of technology engagement that illuminated the value in moving from teacher-directed learning to student ownership with greater flexibility of instruction for diverse learners.
As the TIM was implemented, educators received an orientation into the scope and purpose of the TIM Tools. Administrators and teachers enrolled in TIM courses to deepen their understanding of applying the matrix to classroom instruction. Teachers were encouraged to identify levels of technology integration in their lessons and to reflect upon how their choice corresponded with the learning environment description in the TIM. Given the TIM’s detailed charts and goals to guide them, teachers were motivated to adapt levels to best advance student learning.
Through the partnership with S3 Technologies and St. Michael, the TIM formed a basis for intentional discussions to gain an understanding of where to focus coaching efforts and resources to increase comfort levels for better technology use. As use was documented and charted with the TUPS, purchasing decisions were adapted to advance growth and avoid waste from unused tools.
As a result, the team of collaborators used the TIM Tools to grow the perception of the role of technology and the way it is used in the school. The successful implementation of the TIM proved to be an essential variable that was mission critical as St. Michael faced an immediate need to adapt to remote learning in March 2020. In sum:
- The TIM matrix met the need for a common vocabulary and shared understanding of what technology integration looks like in action.
- The TIM matrix descriptors and TIM-O observation tools generate conversations around when and in what way technology integration best serves student learning.
- The TUPS and TIM-O provide data to identify where educators are comfortable in using technology and where they need professional development or different technology tools.
- The TIM-O, TIM-C, and the TUPS provide a forum for reflection and feedback on technology use in a constructive way.
- The TUPS and TIM-O provide evidence of use and perceptions that helps decision making for technology purposes and technology allotment.
In comparing data across four school years, the TIM shows significant growth over time in improved technology use, effective professional development, positive change in perceptions and comfort levels and increased skill sets that directly impacted the approach to instruction and resulting quality of student engagement in learning.
While the areas of growth continue to be areas of focus, significant forward motion has been achieved in addressing the needs identified in 2016. This can be seen when comparing the 2016 responses to the seven sections of the TUPS with the 2020 responses. The following graphs are reproduced with an analysis from a 2021 technology conference presentation, “Graphing Growth: TIM Tools in Action” by Tricia Dirker.
Technology Access and Support
The first section of the TUPS survey measures access to the technology specialist (or school-based technology support staff). This data provides a sense of what kind of support teachers have with using technology in their curriculum.
Figure 1 shows growth in teacher access and support from a technology specialist. This school’s 2016 data is not unlike the baseline data from most schools. Most schools provide adequate technical assistance, but lack assistance with integrating or implementing technology in the classroom. Based on the 2016 data, St. Michael intentionally implemented professional development paired with coaching that focused on practical uses of technology in teachers’ own curriculum. This data confirms that the school has been spending funding and time on the right type of support that the teachers need and want.

Figure 1. Technology Access and Support section of the Technology Uses and Perceptions Survey (TUPS) comparing the 2016 administration with the 2020 administration. Click to enlarge.
Preparation for Technology Use
The second section asks: “To what extent do you think the following types of technology-related professional development would be beneficial to you?” This data identifies the means through which current teachers have gained technology skills.
Figure 2 documents the shift toward greater teacher utilization of In-Service/Coaching and Distance Learning professional development to gain skills and knowledge. Schools and districts can strategically plan professional development in multiple formats. For instance, at St. Michael School every teacher (in 2018) participated in an online course, to give them the experience from a student’s perspective of online instruction. Teachers were then able to take this experience and apply it in their own classrooms in 2020 when faced with an expedited need for online learning.
In addition, each of these data points can be drilled down to the individual level. Therefore, smaller trainings can be arranged to address specific individuals at the level they need. This information was used to identify “TIM Coaches” (teachers who could mentor other teachers in the integration of technology) and “power users” who could assist others when the technology specialist is not onsite.

Figure 2. Preparation for Technology Use section of the TUPS comparing the 2016 administration with the 2020 administration. Click to enlarge.
This first section also identifies what technology-related professional development teachers view as beneficial.
Figure 3 notes the shift from the need for introductory technology skills, professional productivity (which was targeted to a large extent in 2019), and instructional apps to training on pedagogy and applications students use. At this school, the first year was devoted to introductory skills and pedagogy. The ensuing years, we were able to focus on higher level technology integration. 2019 was focused on professional productivity and instructional application. With the onset of COVID-19, there is a renewed need for pedagogical training as it pertains to hybrid and remote learning, especially.
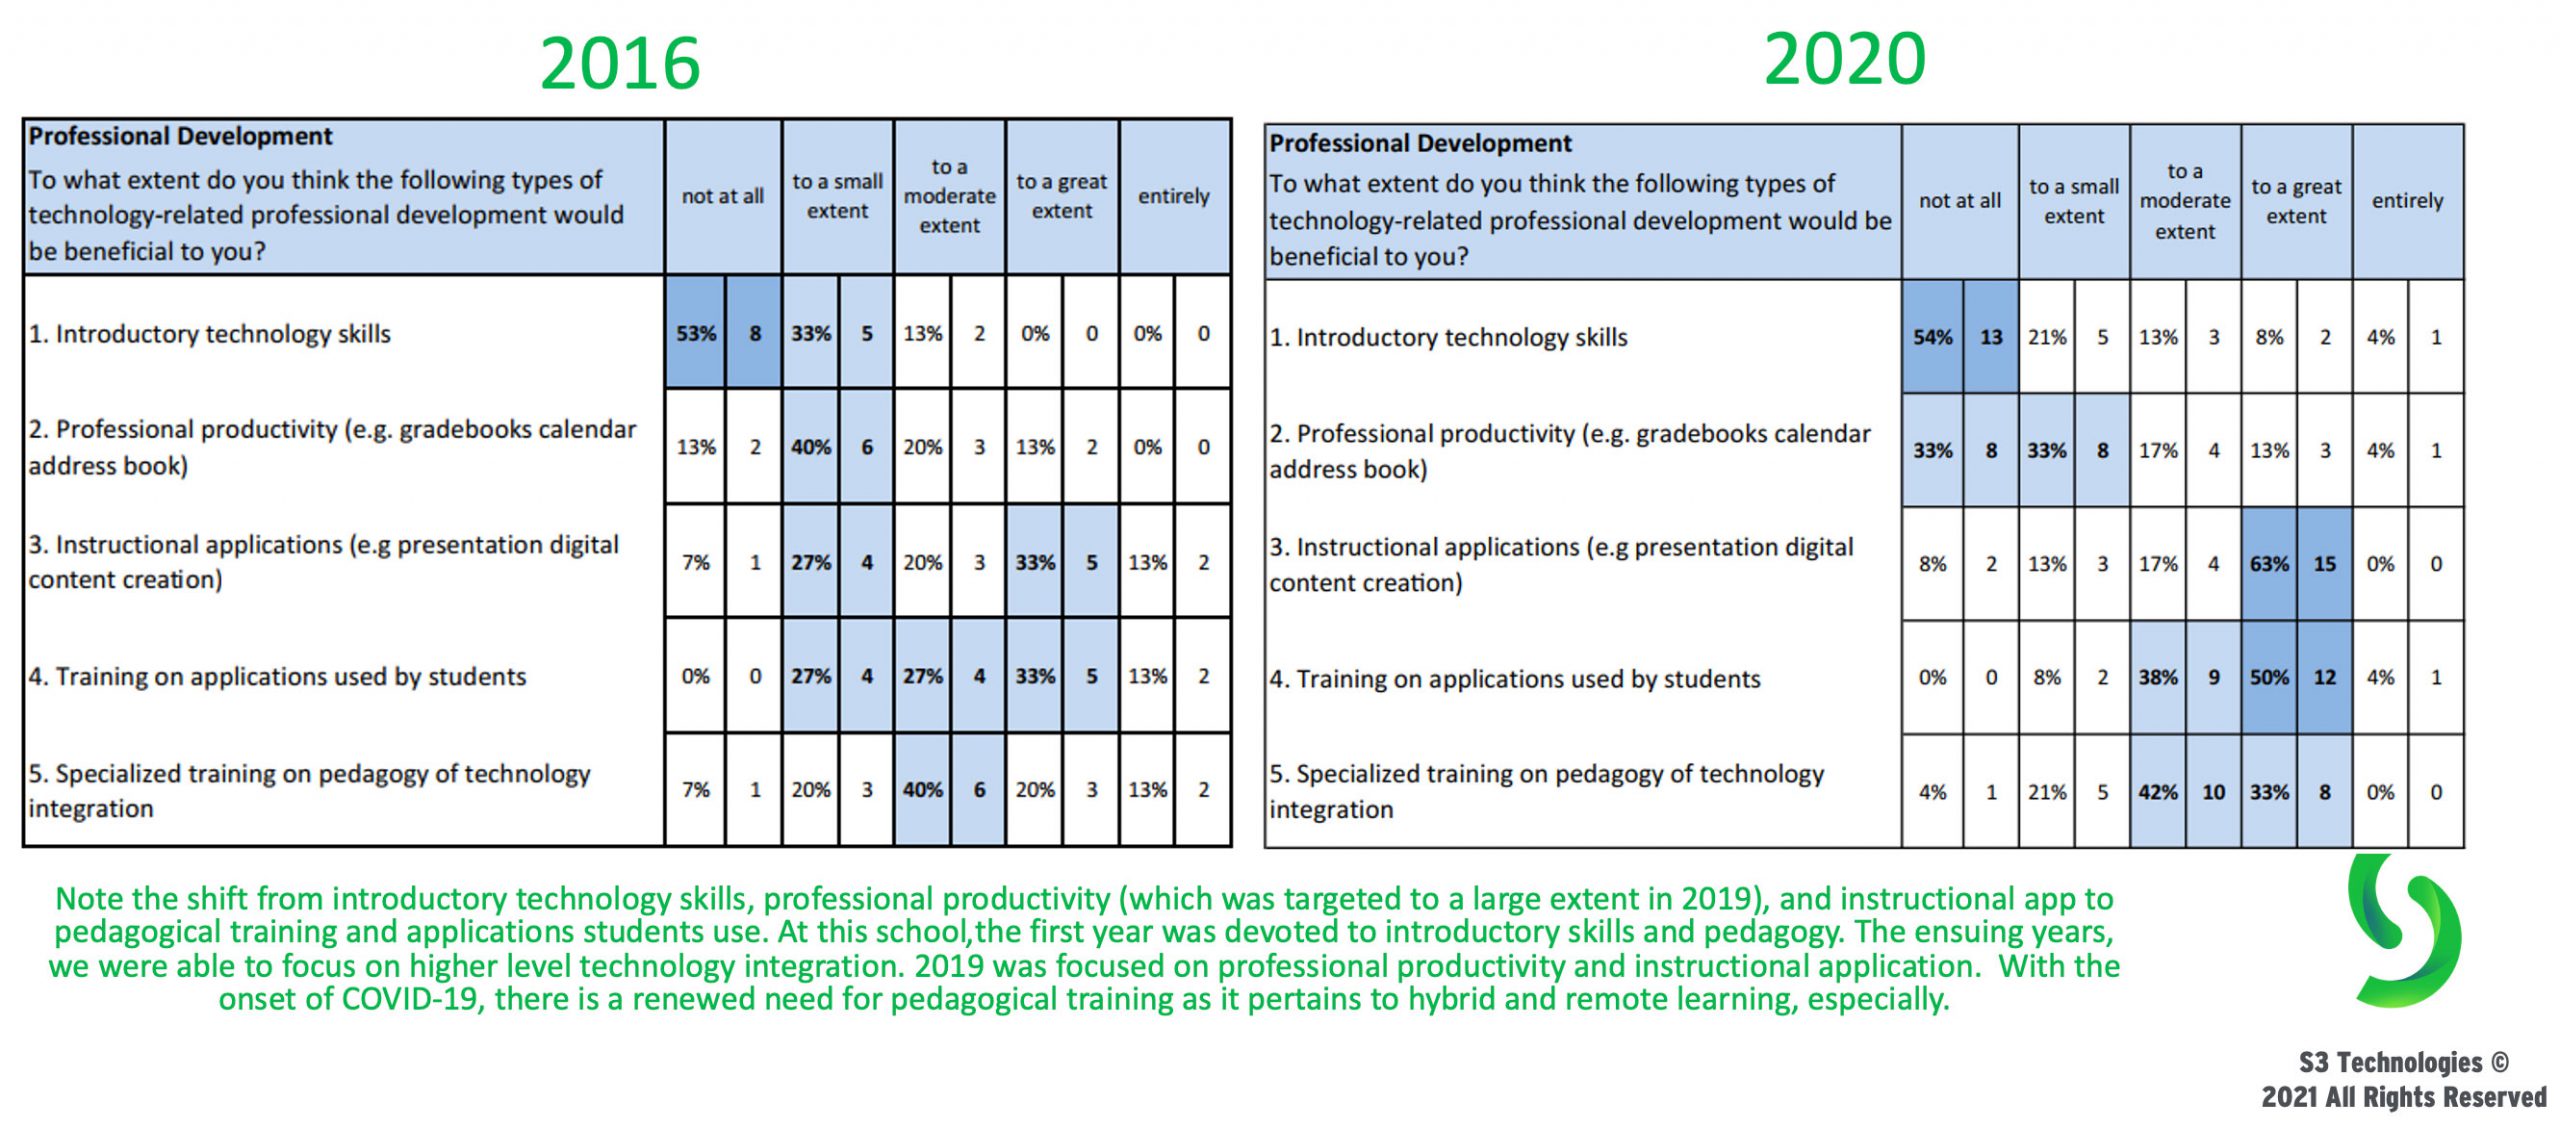
Figure 3. Shift in professional development responses in the Preparation for Technology Use section of the TUPS. Click to enlarge.
Perceptions of Technology Use
This section helps identify the role teachers perceive technology playing in how they teach, when and how they use technology, and more.
When compared year to year, note the shift in perception of importance for student devices and how the use of technology changes the role and pedagogy of the teacher. St. Michael was also intentional on creating a work environment where teachers were encouraged to share their successes and felt comfortable reaching out to each other for assistance. The data in figure 4 shows that over 50% of the teachers feel comfortable assisting another teacher with technology.
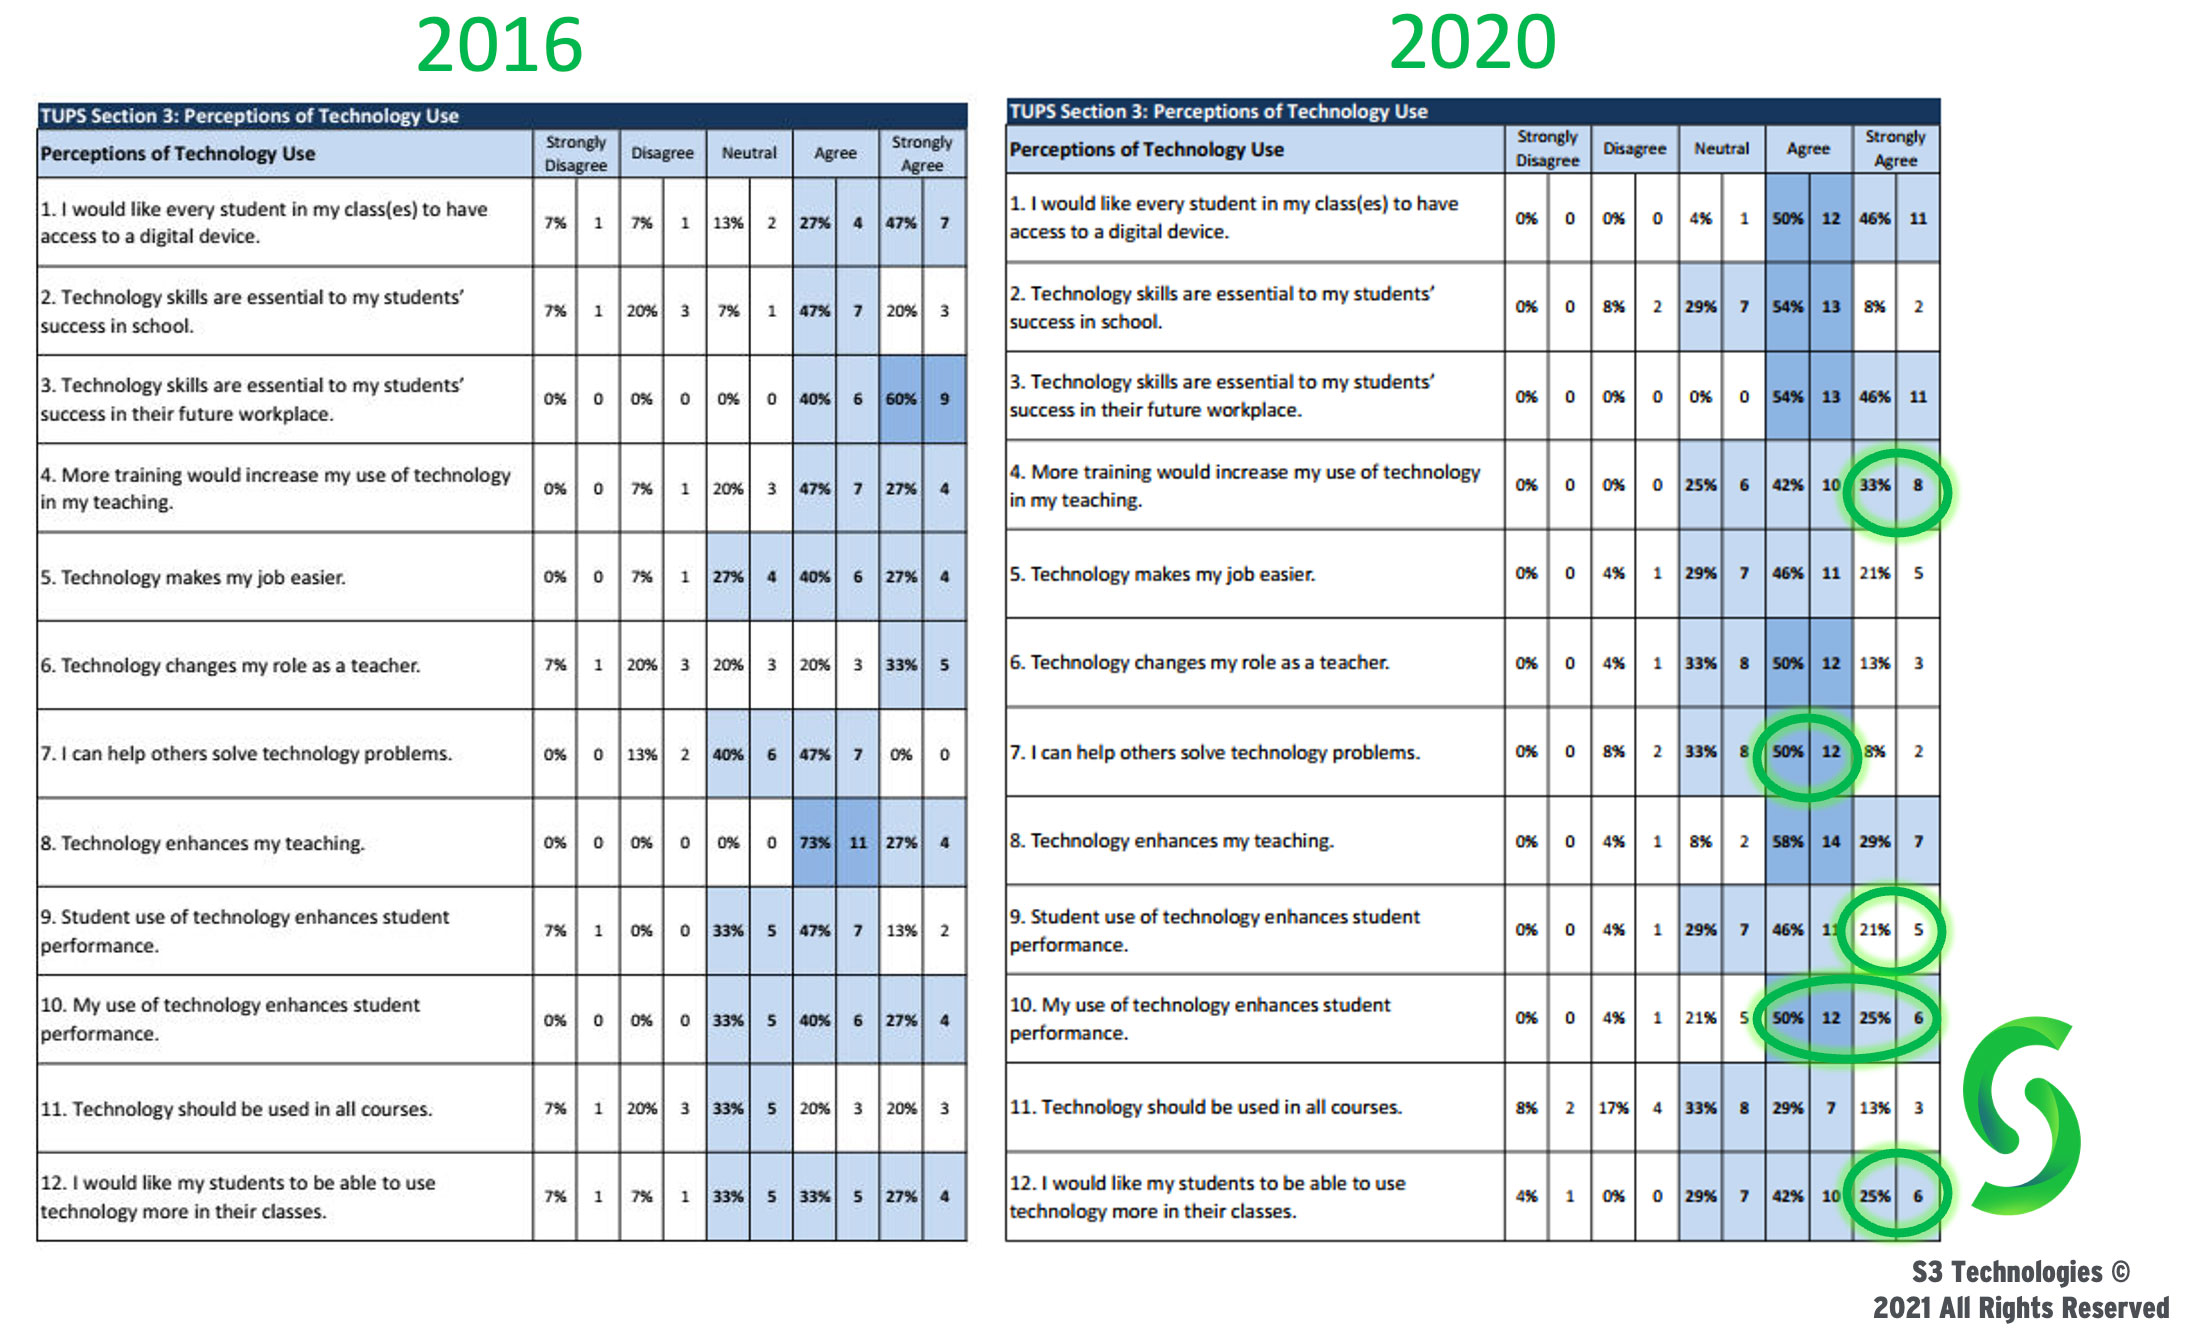
Figure 4. Perceptions of Technology Use section of the TUPS. Click to enlarge.
Confidence and Comfort Using Technology
This data identifies how confident and comfortable a teacher is in using technology, which makes them more likely to use technology and to use it in new and innovative ways.
Figure 5 shows growth in teacher confidence. This data can also be used to identify professional development needs. For instance, multimedia and copyright were focused on two years ago. However, by 2020, new teachers joined the school. Therefore, this data lets us know that it is time to reteach those topics.
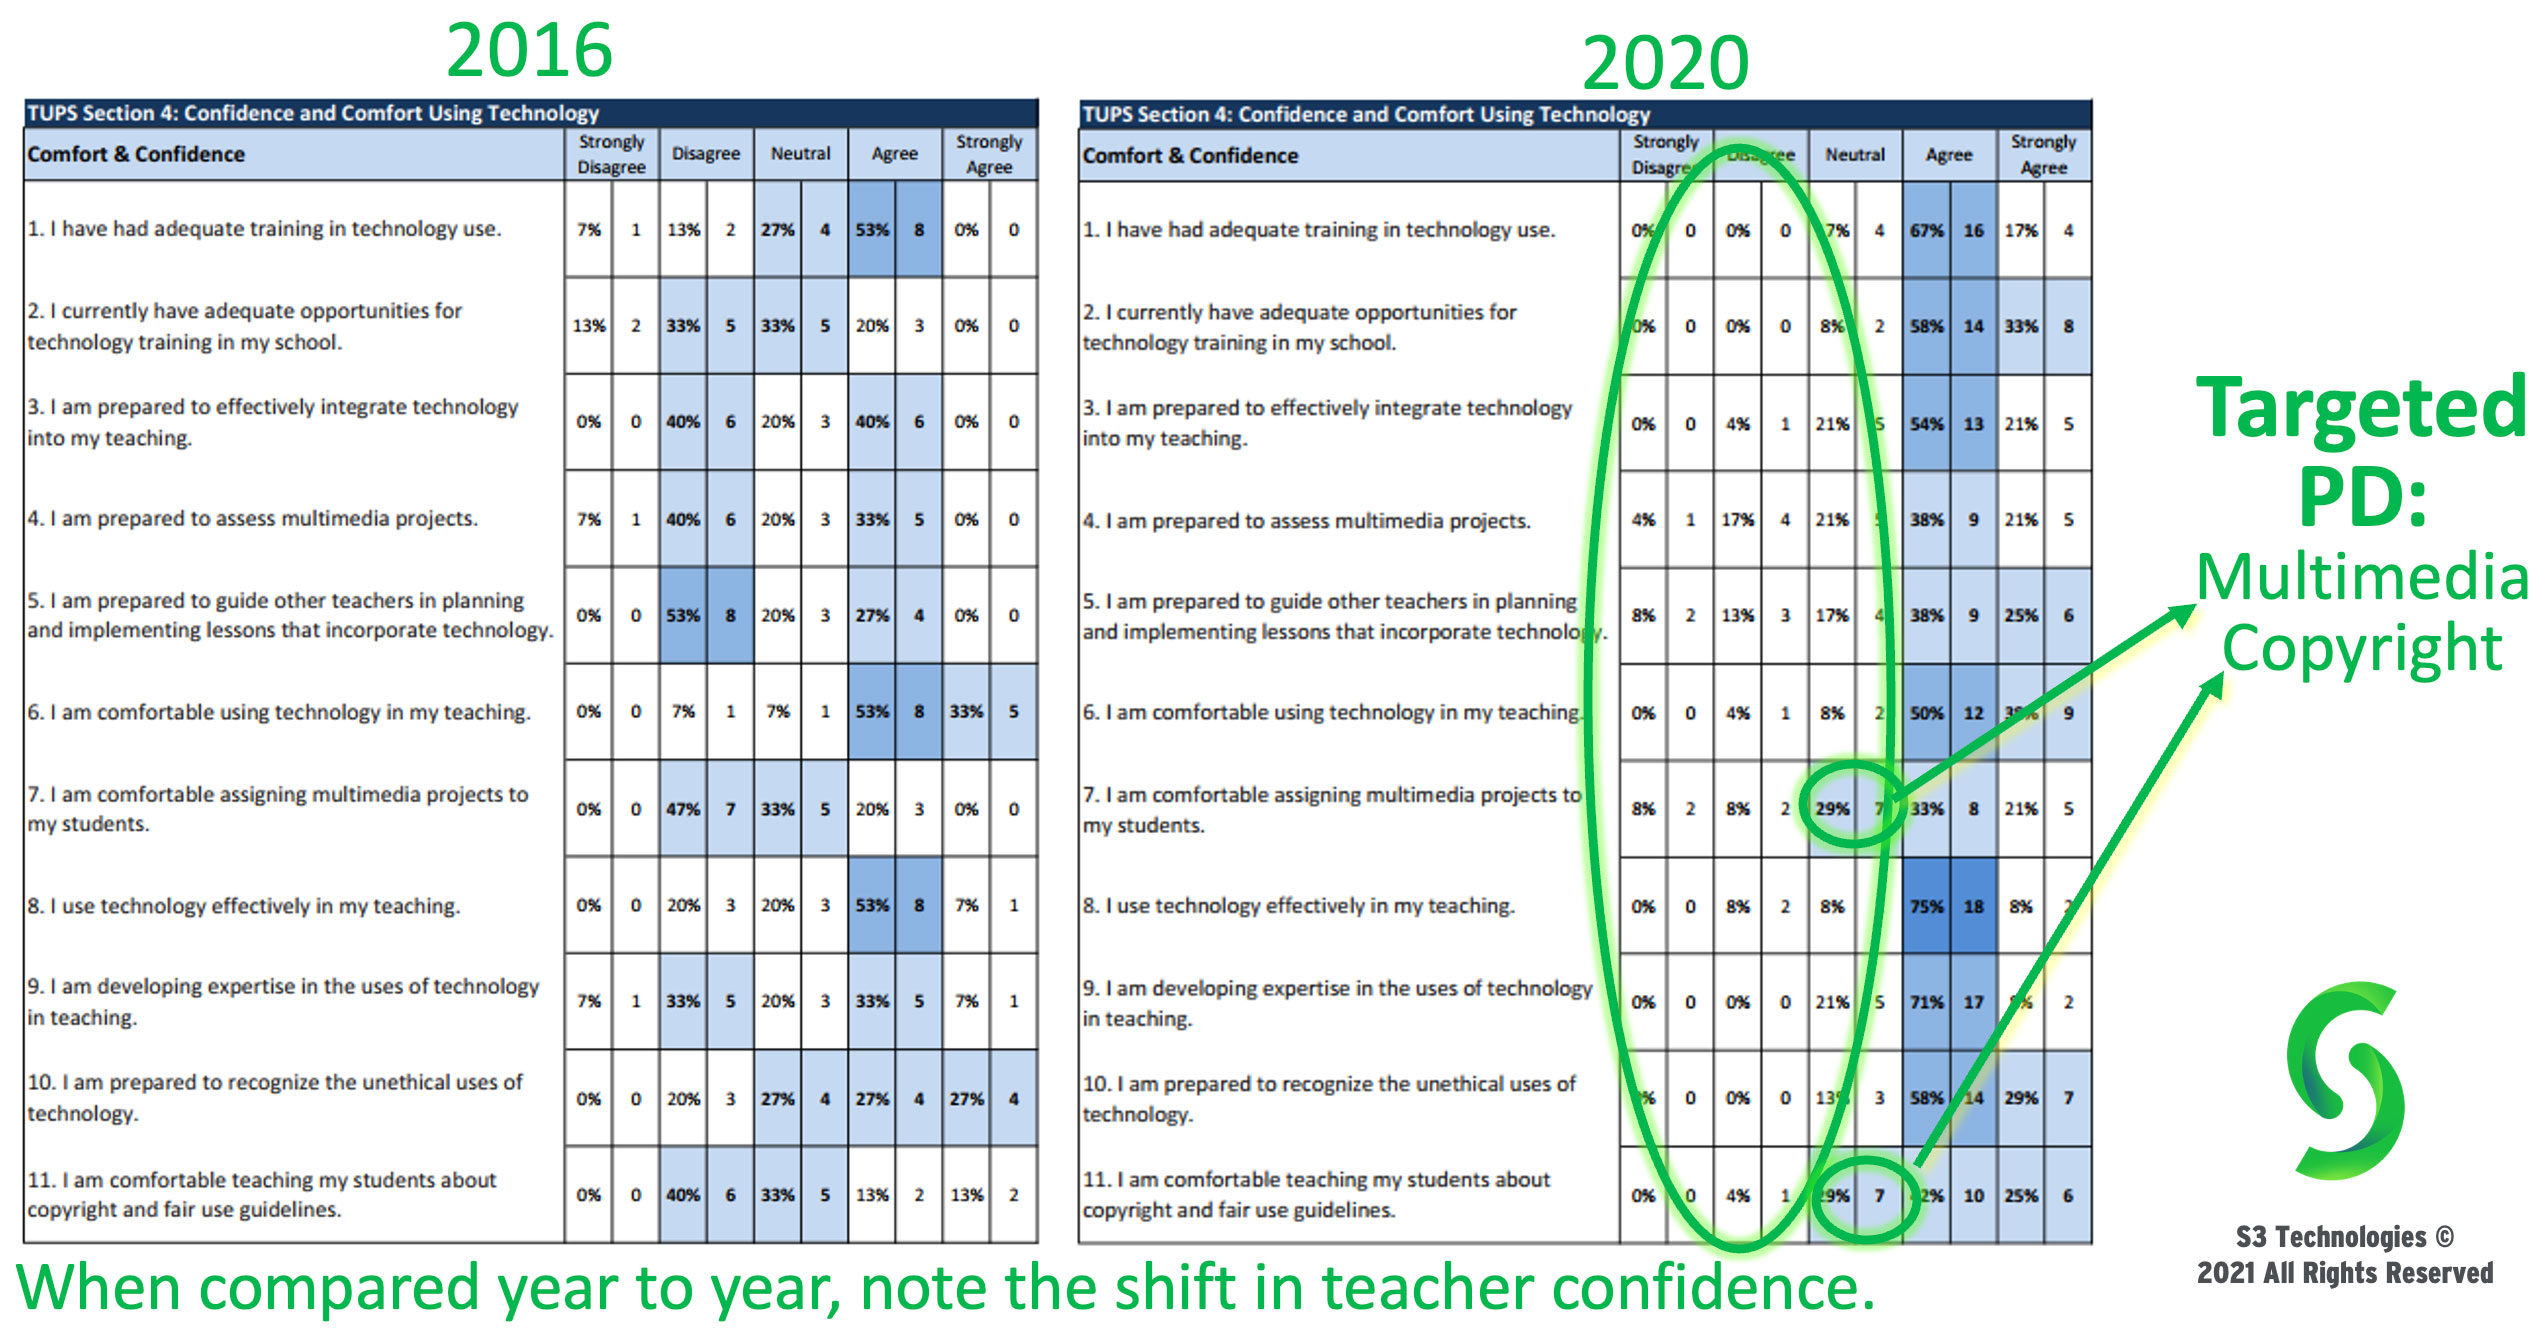
Figure 5. Confidence and Comfort Using Technology section of the TUPS. Click to enlarge.
Technology Integration
Section 5 of the TUPS identifies the role teachers perceive technology playing in how they teach, when and how they use technology, and more.
Figure 6 shows that from 2016 to 2020, teachers began to regularly use technology in a variety of learning situations. Over the last four years, targeted professional development was provided on student research, small group instruction, cooperative instruction, goal setting/project management, and creating online assessments. The data suggests most teachers are now using technology in these situations multiple times a week.
It is now anticipated that the range of technology uses will expand greatly this year. In particular, current professional development is intentionally focused on increasing the use of technology to discuss or communicate with students.
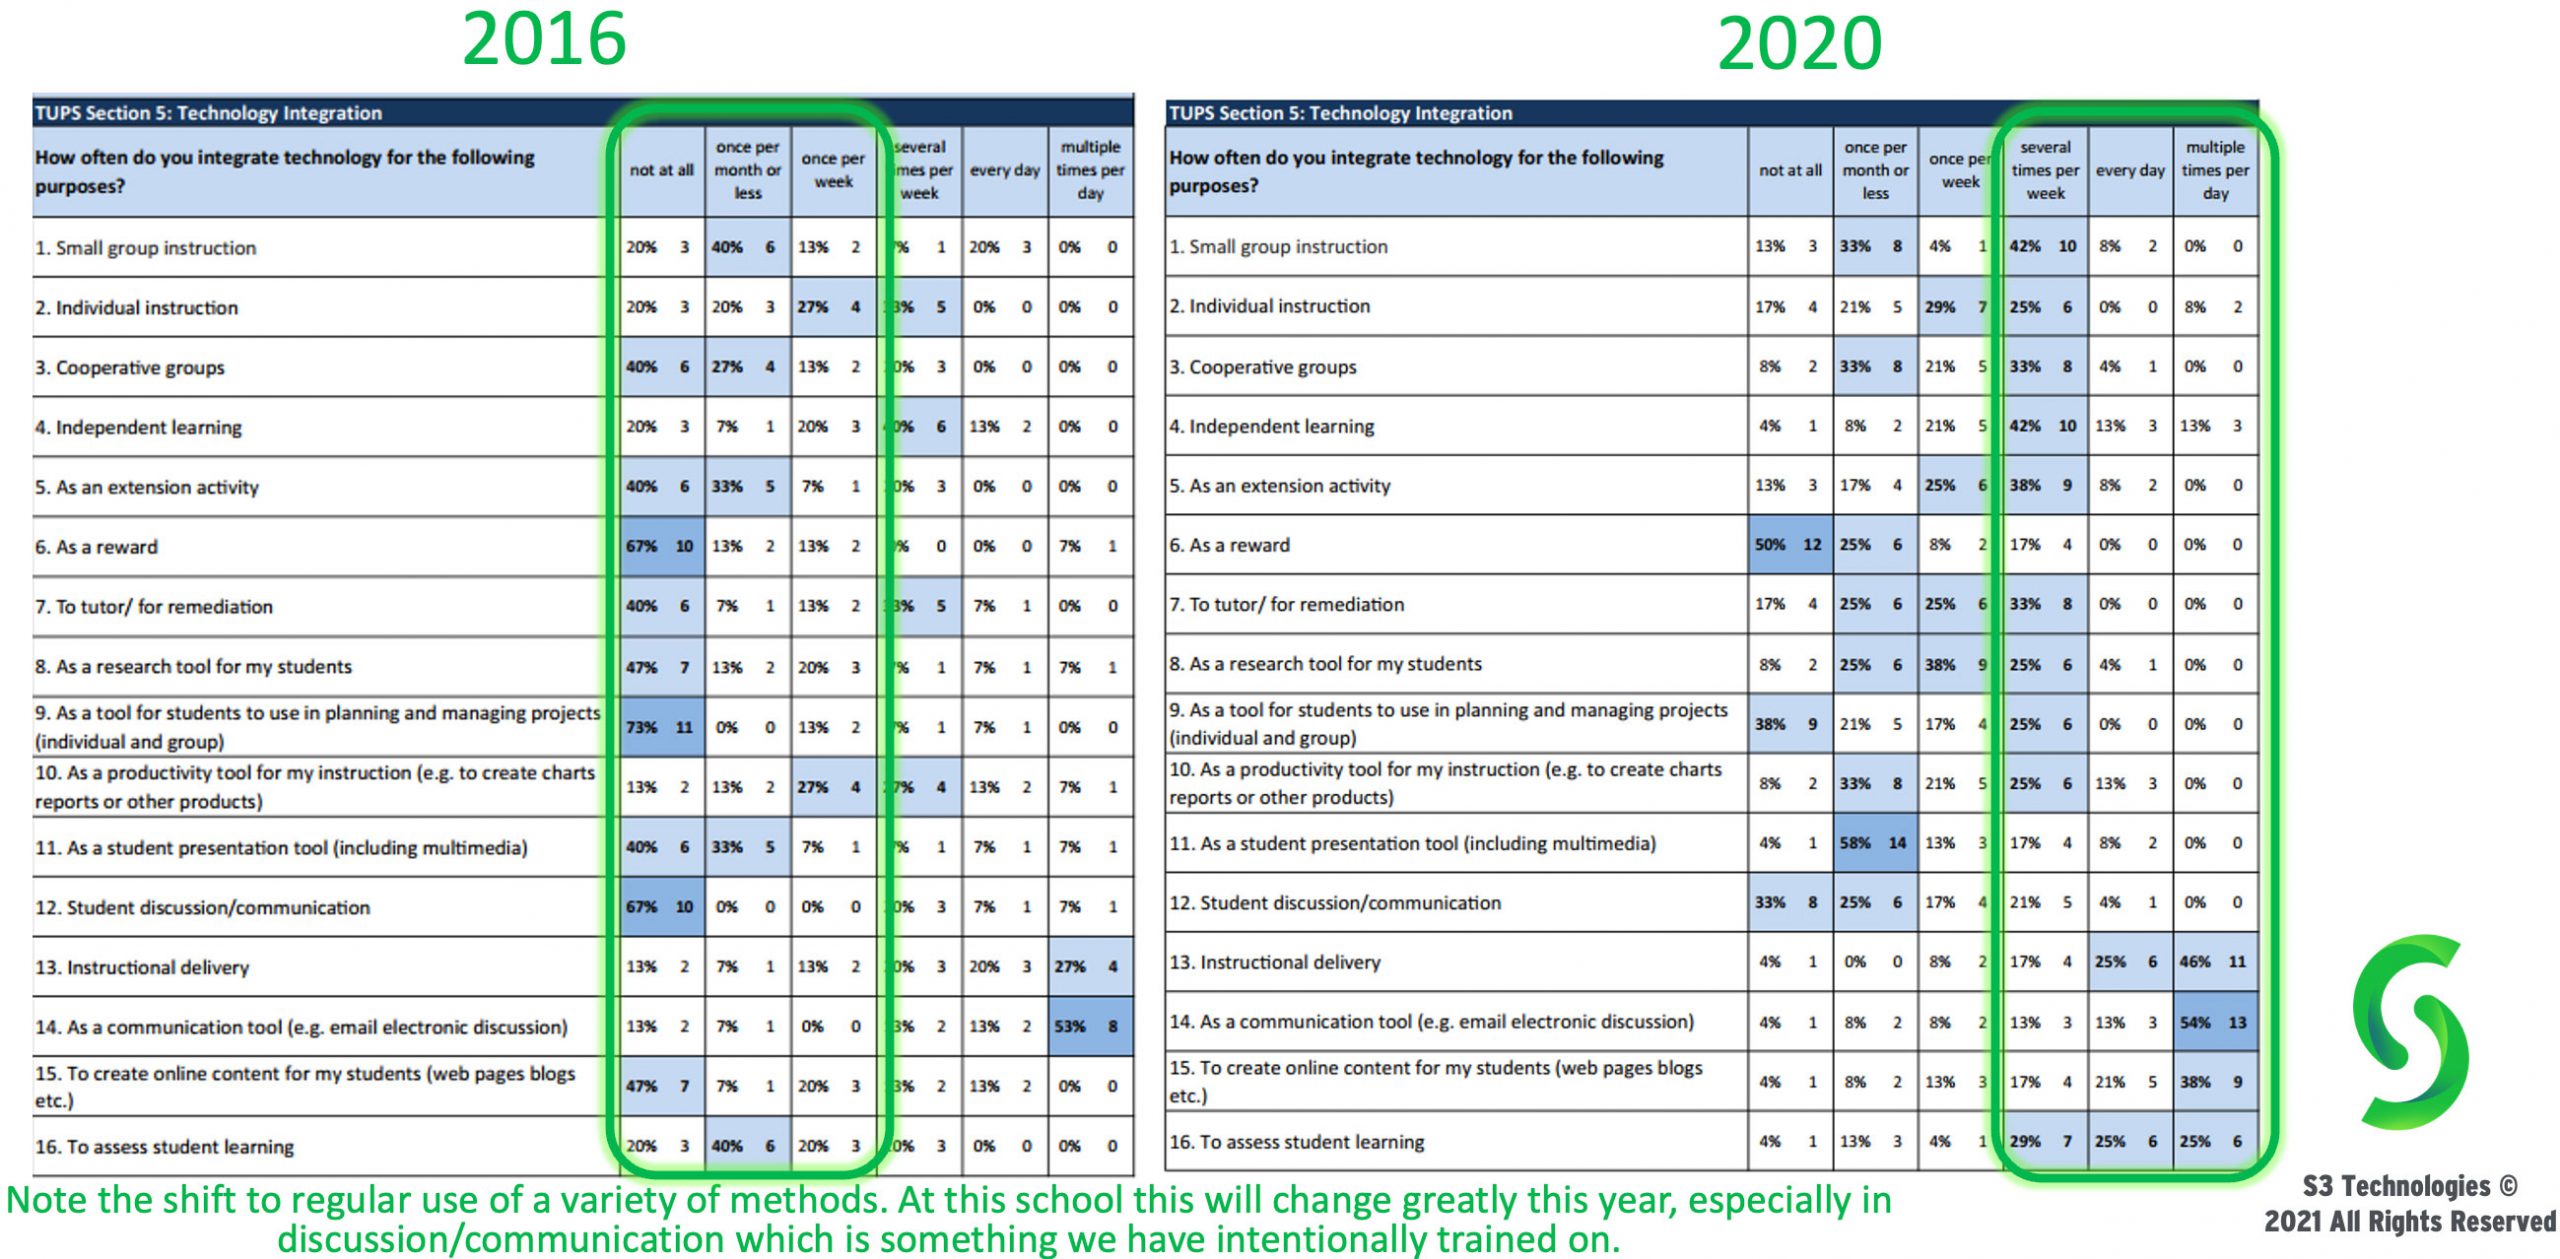
Figure 6. Technology Integration section of the TUPS. Click to enlarge.
Teacher and Student Use of Technology
From this data, the school can identify the technologies teachers and students use and how often they use them. The teachers are asked about a variety of types of technology tools (word processing, spreadsheets, multimedia, etc.) twice. The first section asks how often they, the teachers, use the technology in their classroom. The second sections, asks how often their students use those same technology tools. Again, this data can be used to drive budgeting and professional development.
Regarding teacher technology use, there is a shift in regular use of desktop to use of laptops. In this school’s case, the tools the teachers are using for their day-to-day instruction have gradually begun to change. However, the big changes are seen in the technology tools students use. In 2016, there were several technologies that were not used at all by any students. By 2020, students are using a wider variety of technology and more regularly. Targeted coaching and professional development assisted teachers in incorporating these new tools into student learning.

Figure 7. Teacher Use of Technology. Click to enlarge.
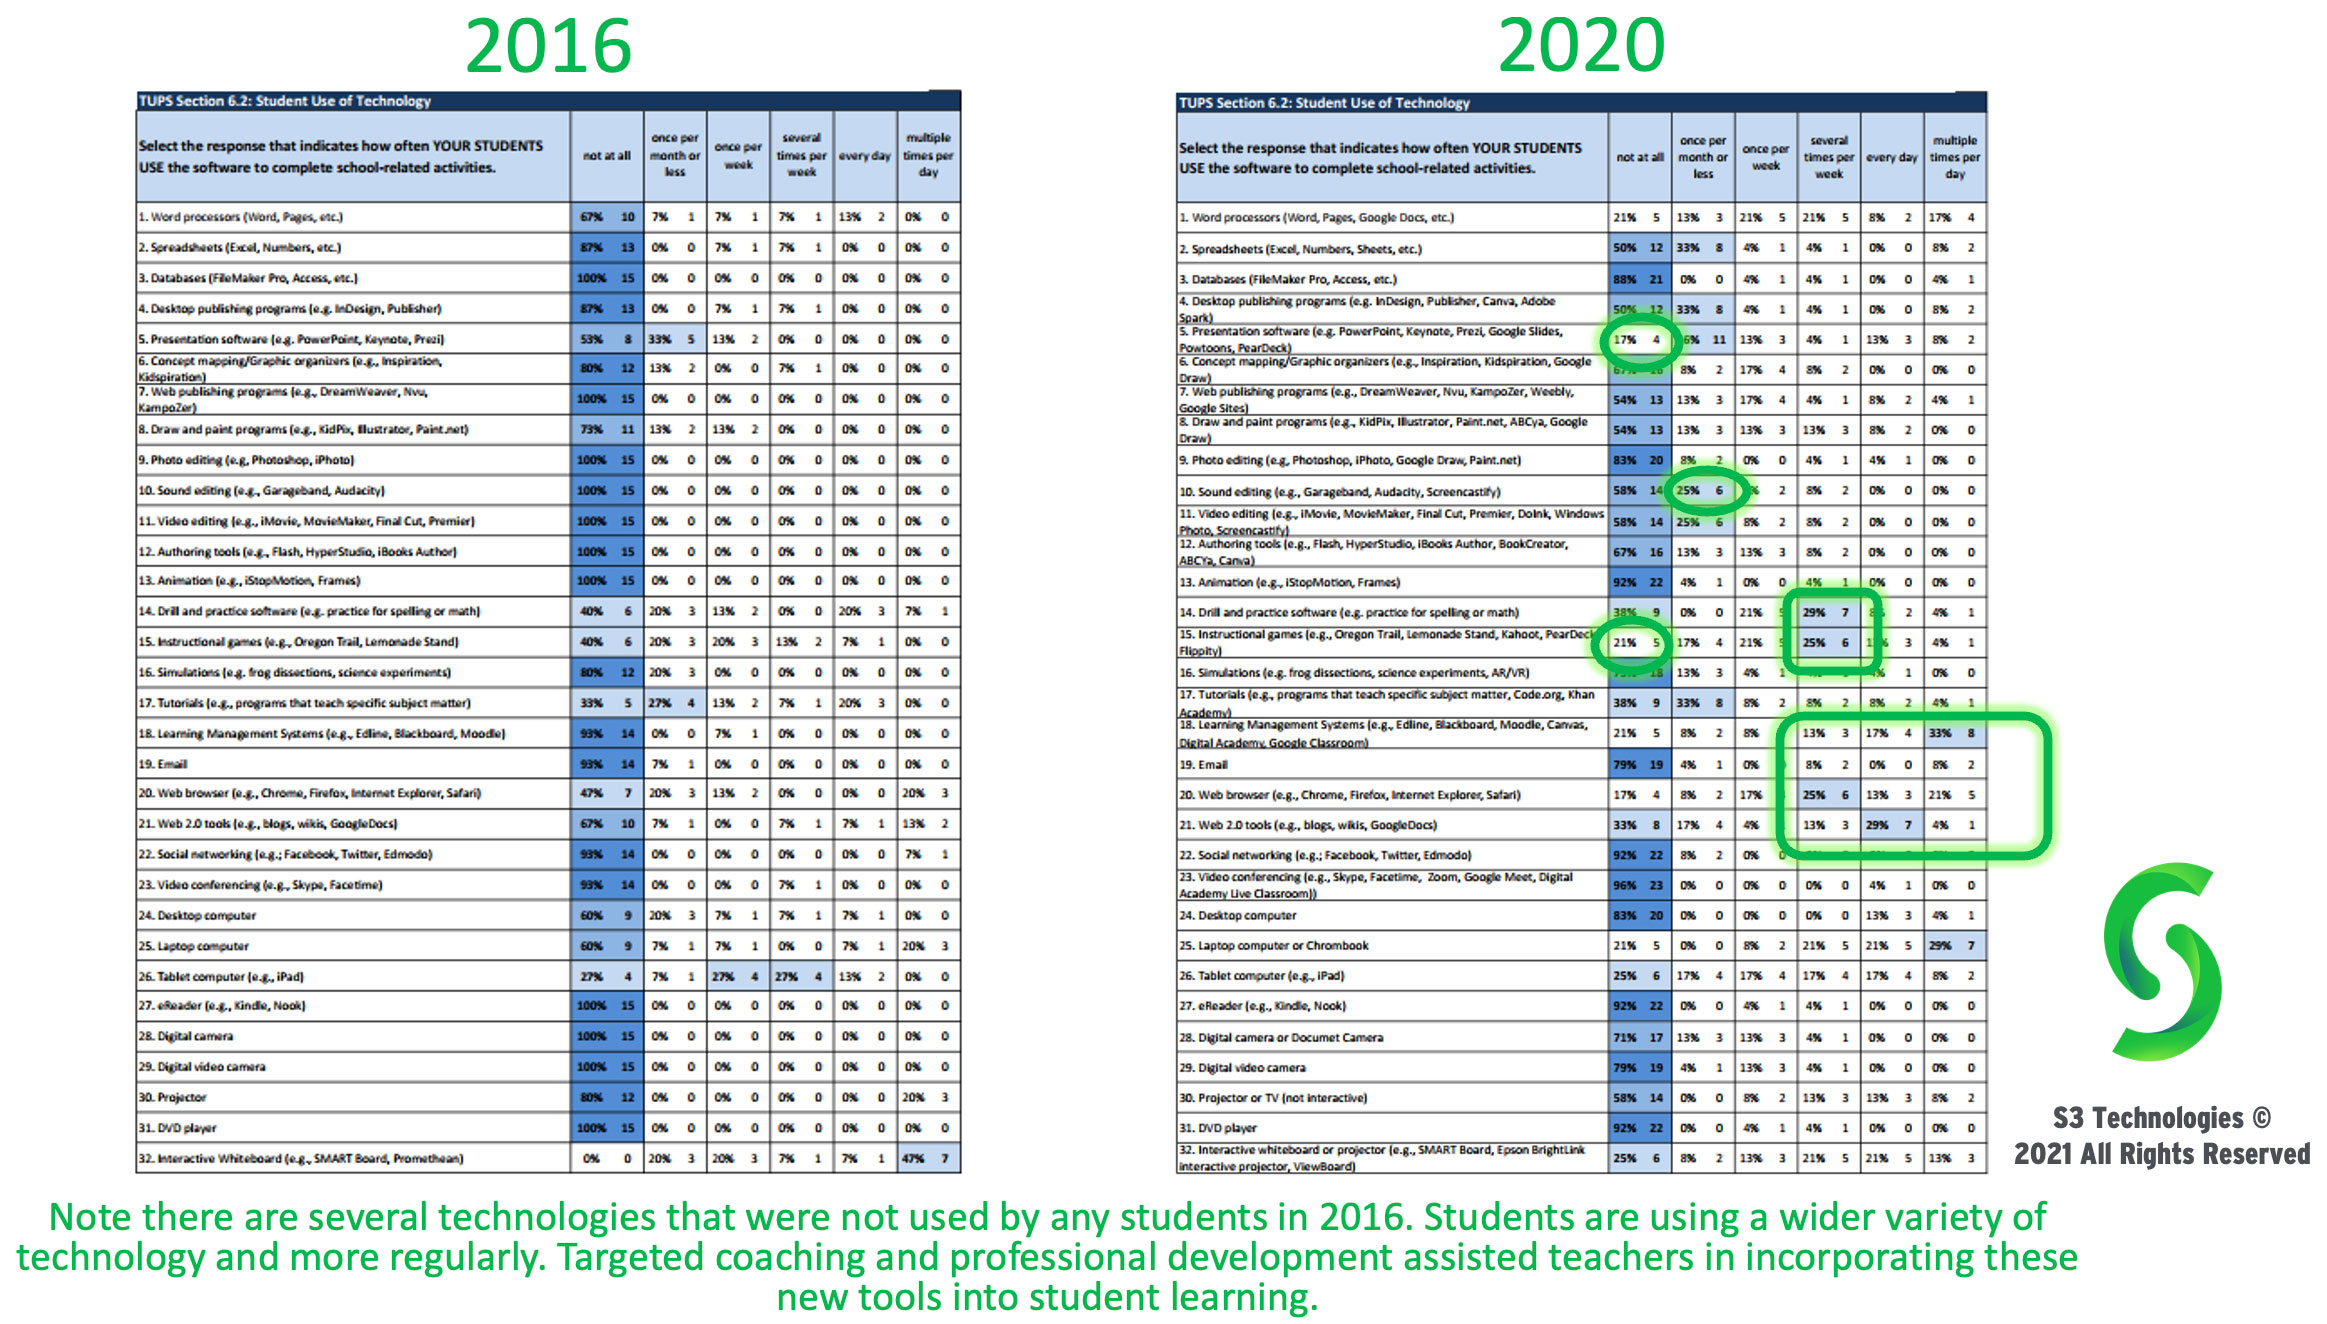
Figure 8. Student Use of Technology. Click to enlarge.
Technology Skills and Usefulness
In section seven of the TUPS, the teachers are asked about the same technology tools as they were in the previous section. However, this time, they are not rating how often they or the students are using the tools. Instead, they are asked first to rank their skill level with each tool. Then, the teachers indicate their perception of how useful each tool is in the classroom.
Numerous data points and charts can be used from this section of the TUPS. The most useful, perhaps, are the “Quadrant” Analyses.
The teachers’ responses to the two parts of this section are correlated to identify which “quadrant” best defines their skill and usefulness. By using these quadrants, professional development can be targeted based on whether it needs to be skill or application-focused (or both). This data also provides insight into whether or not the teachers see value in learning/using a specific tech tool. When implementing professional development of a Quadrant III or IV tool, the practical use of the tool needs to be explained up front to gain teacher buy-in for the training. Whereas, tools identified as Quadrant I are tools that the teachers KNOW they need to use in the classroom, but they just need to learn the skills. Therefore, these are training sessions the teachers already want and need. The technology tools that are identified as Quadrant II are tools the teachers are both comfortable with and feel are important to use. Not a lot of professional development is needed in this area, however, these data points can be drilled down to identify teacher strengths, prospective teacher tech leads/mentors, pairs of teachers (one high, one low) that can be asked to work together, small groups that DO need the training, etc.
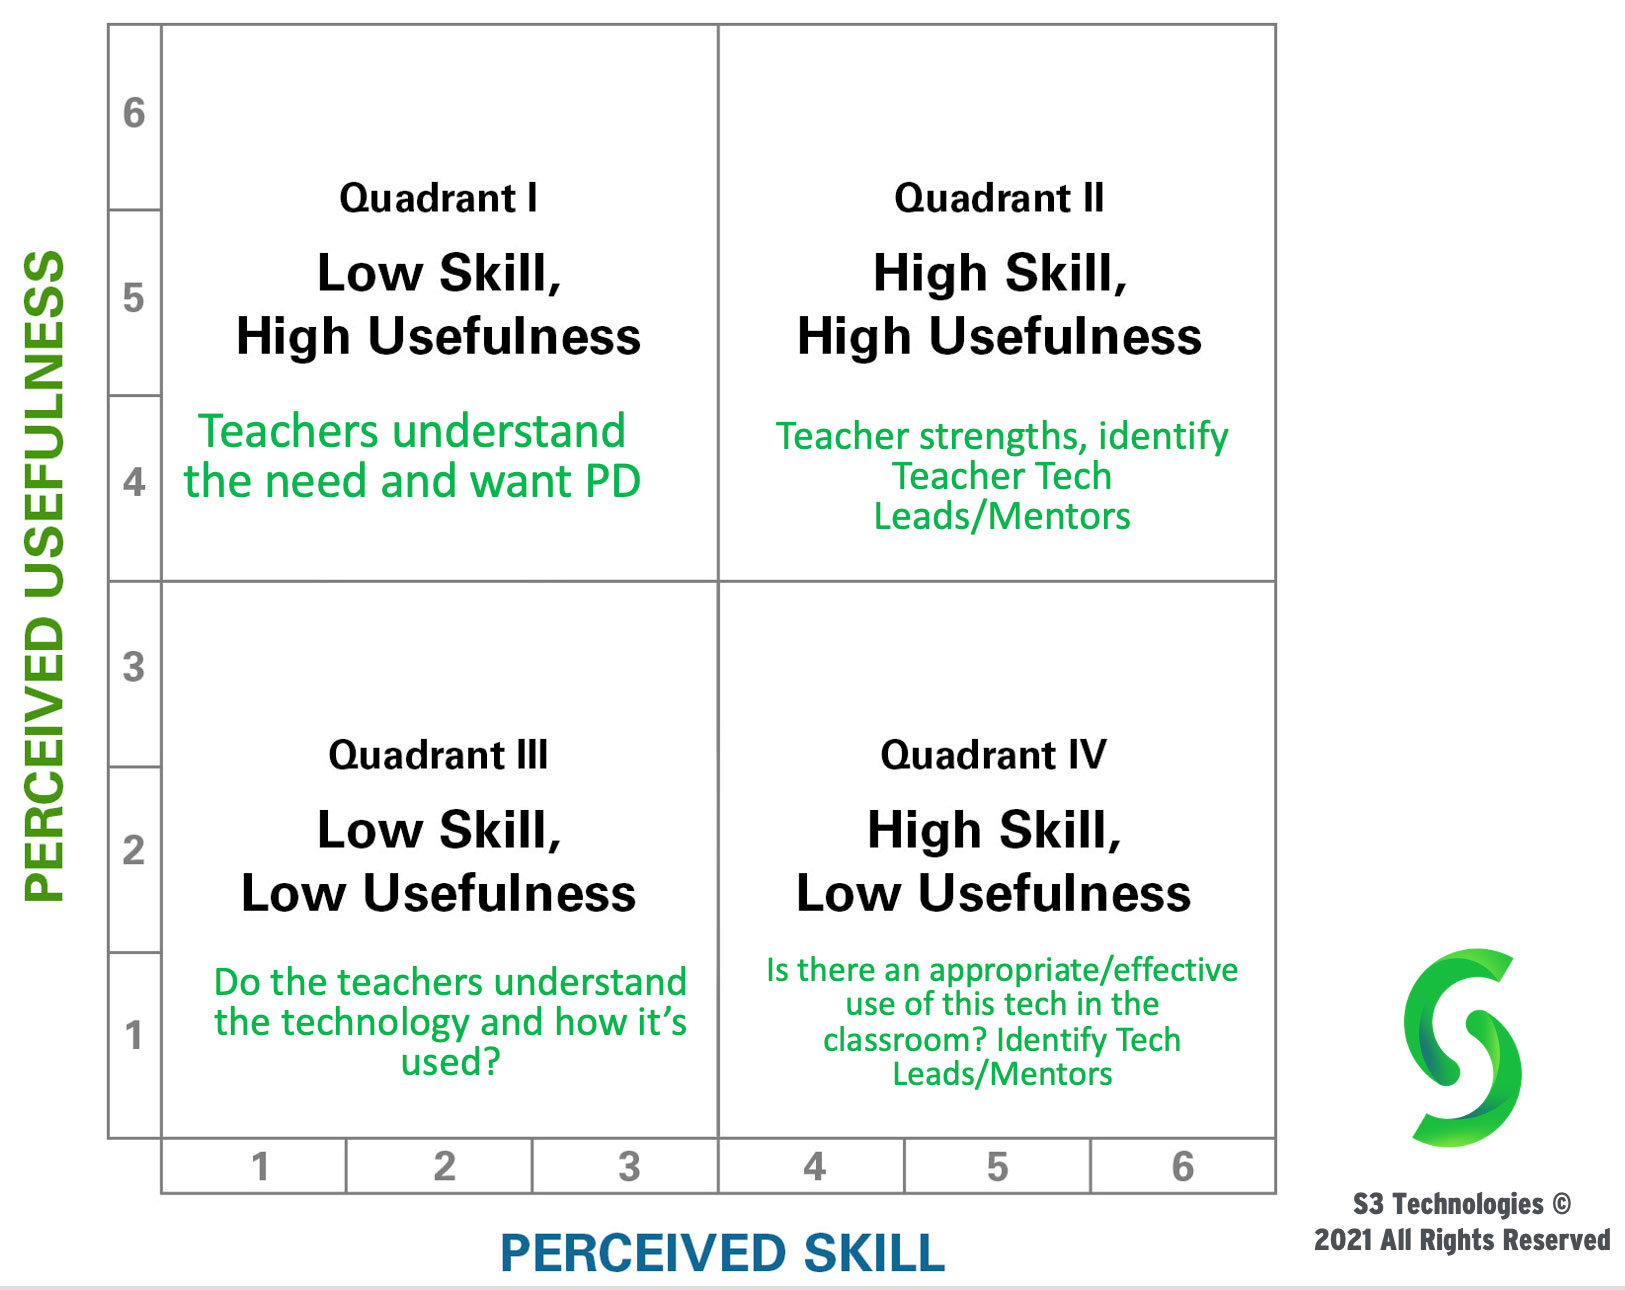
Figure 9. “Quadrant” Analyses. Click to enlarge.
From 2016 to 2020, there are fewer tools that are in Quadrant I (high use, low skill), whereas, there are more tools that are now being rated as Quadrant II (high skill, high use). Again, these can be traced back to targeted professional development and coaching that was provided to teachers over that time. The increase in number of teachers that rank tools as Quadrant II also indicates the increase in teacher skill and use of the different tools. Note, for instance, the shift from Quadrants I and III to Quadrant II in the use of Learning Management Systems (#18). In 2019-2020, the school implemented a new LMS system that enabled online learning. Most professional development and coaching that year focused on using the LMS especially as a tool for remote/distance learning. The fact that the majority of teachers now classify the use of an LMS as Quadrant II means that the teachers feel they are skilled at using it and understand why and how important it is to make full use of the LMS in their classroom.

Figure 10. “Quadrant” Shifts. Click to enlarge.
Samples of Technology Integration Growth
Samples of technology integration growth shown by examining data collected through the TIM-Observation Tool will be provided.
The TIM matrix met the need for a common vocabulary and shared understanding of what technology integration looks like in action.
The TIM matrix focuses on five levels of technology integration (Entry, Adoption, Adaptation, Infusion, and Transformation) in five characteristics of the learning environment (Active, Collaborative, Constructive, Authentic, and Goal Directed).
The TIM provides detailed explanation of what the learning environment looks like for students, teachers, and the physical setting at each level of integration. The descriptors provide the common language needed to set goals and plan and monitor progress toward those goals.
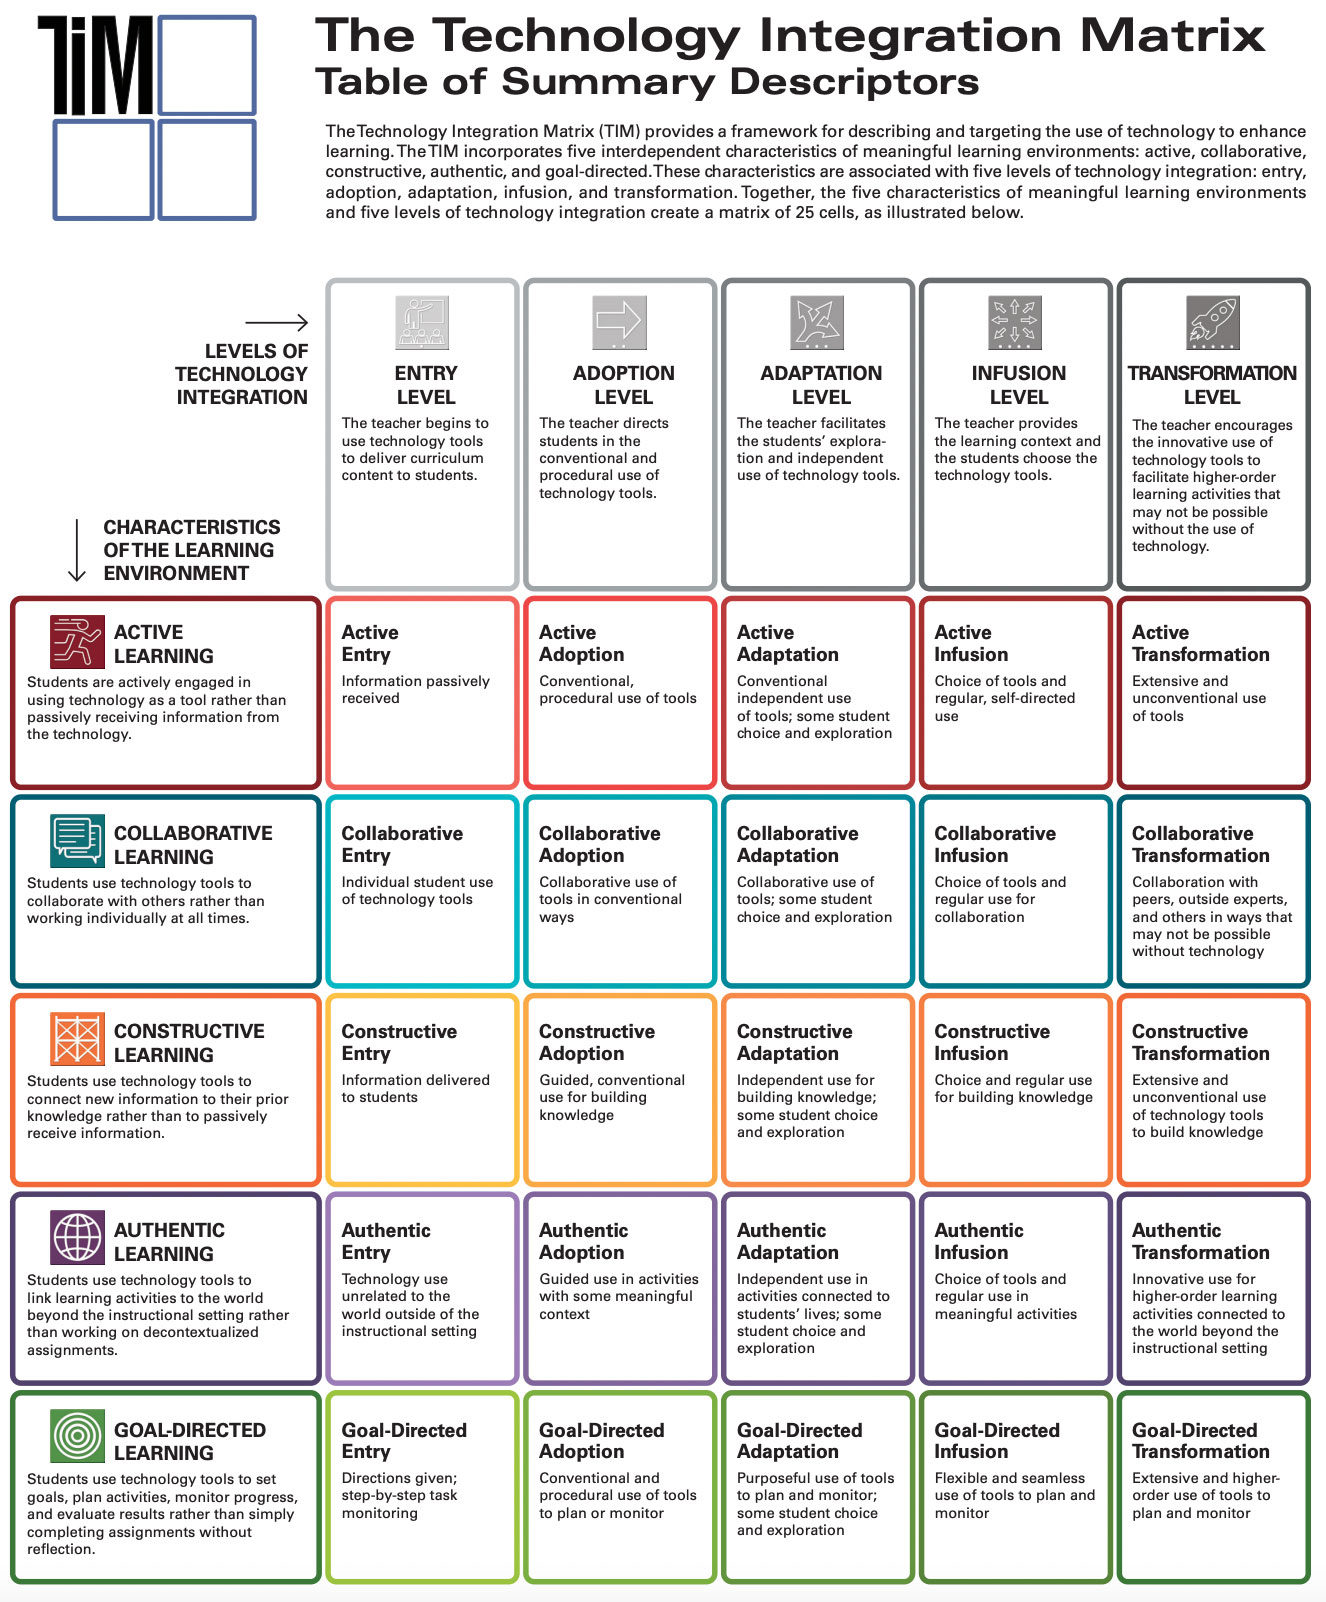
Figure 11. The Technology Integration Matrix summary descriptors. Click to enlarge. The TIM website offers a variety of printer-friendly TIM extended descriptor tables in PDF format.
As teachers progress in the level of technology integration in each of the five characteristics of the learning environment, instruction and learning fundamentally shift from Teacher-Directed to Student-Directed. The ultimate goal of applying the Technology Integration Matrix (TIM) model in the school is not to increase use of technology. On the contrary, technology is a tool that teachers can use to increase student engagement, ownership, high-order thinking skills, and much more.
Using the TIM-O tool, observers can document how actively students are collaborating with technology, of their own choosing, in unconventional ways, to meet their learning goals. The TIM provides descriptions of what each level of integration looks like to the student, the teacher, and the classroom setting. This data can be used to set goals for teachers individually or as an entire staff. The data can then be used to show progress toward those goals.
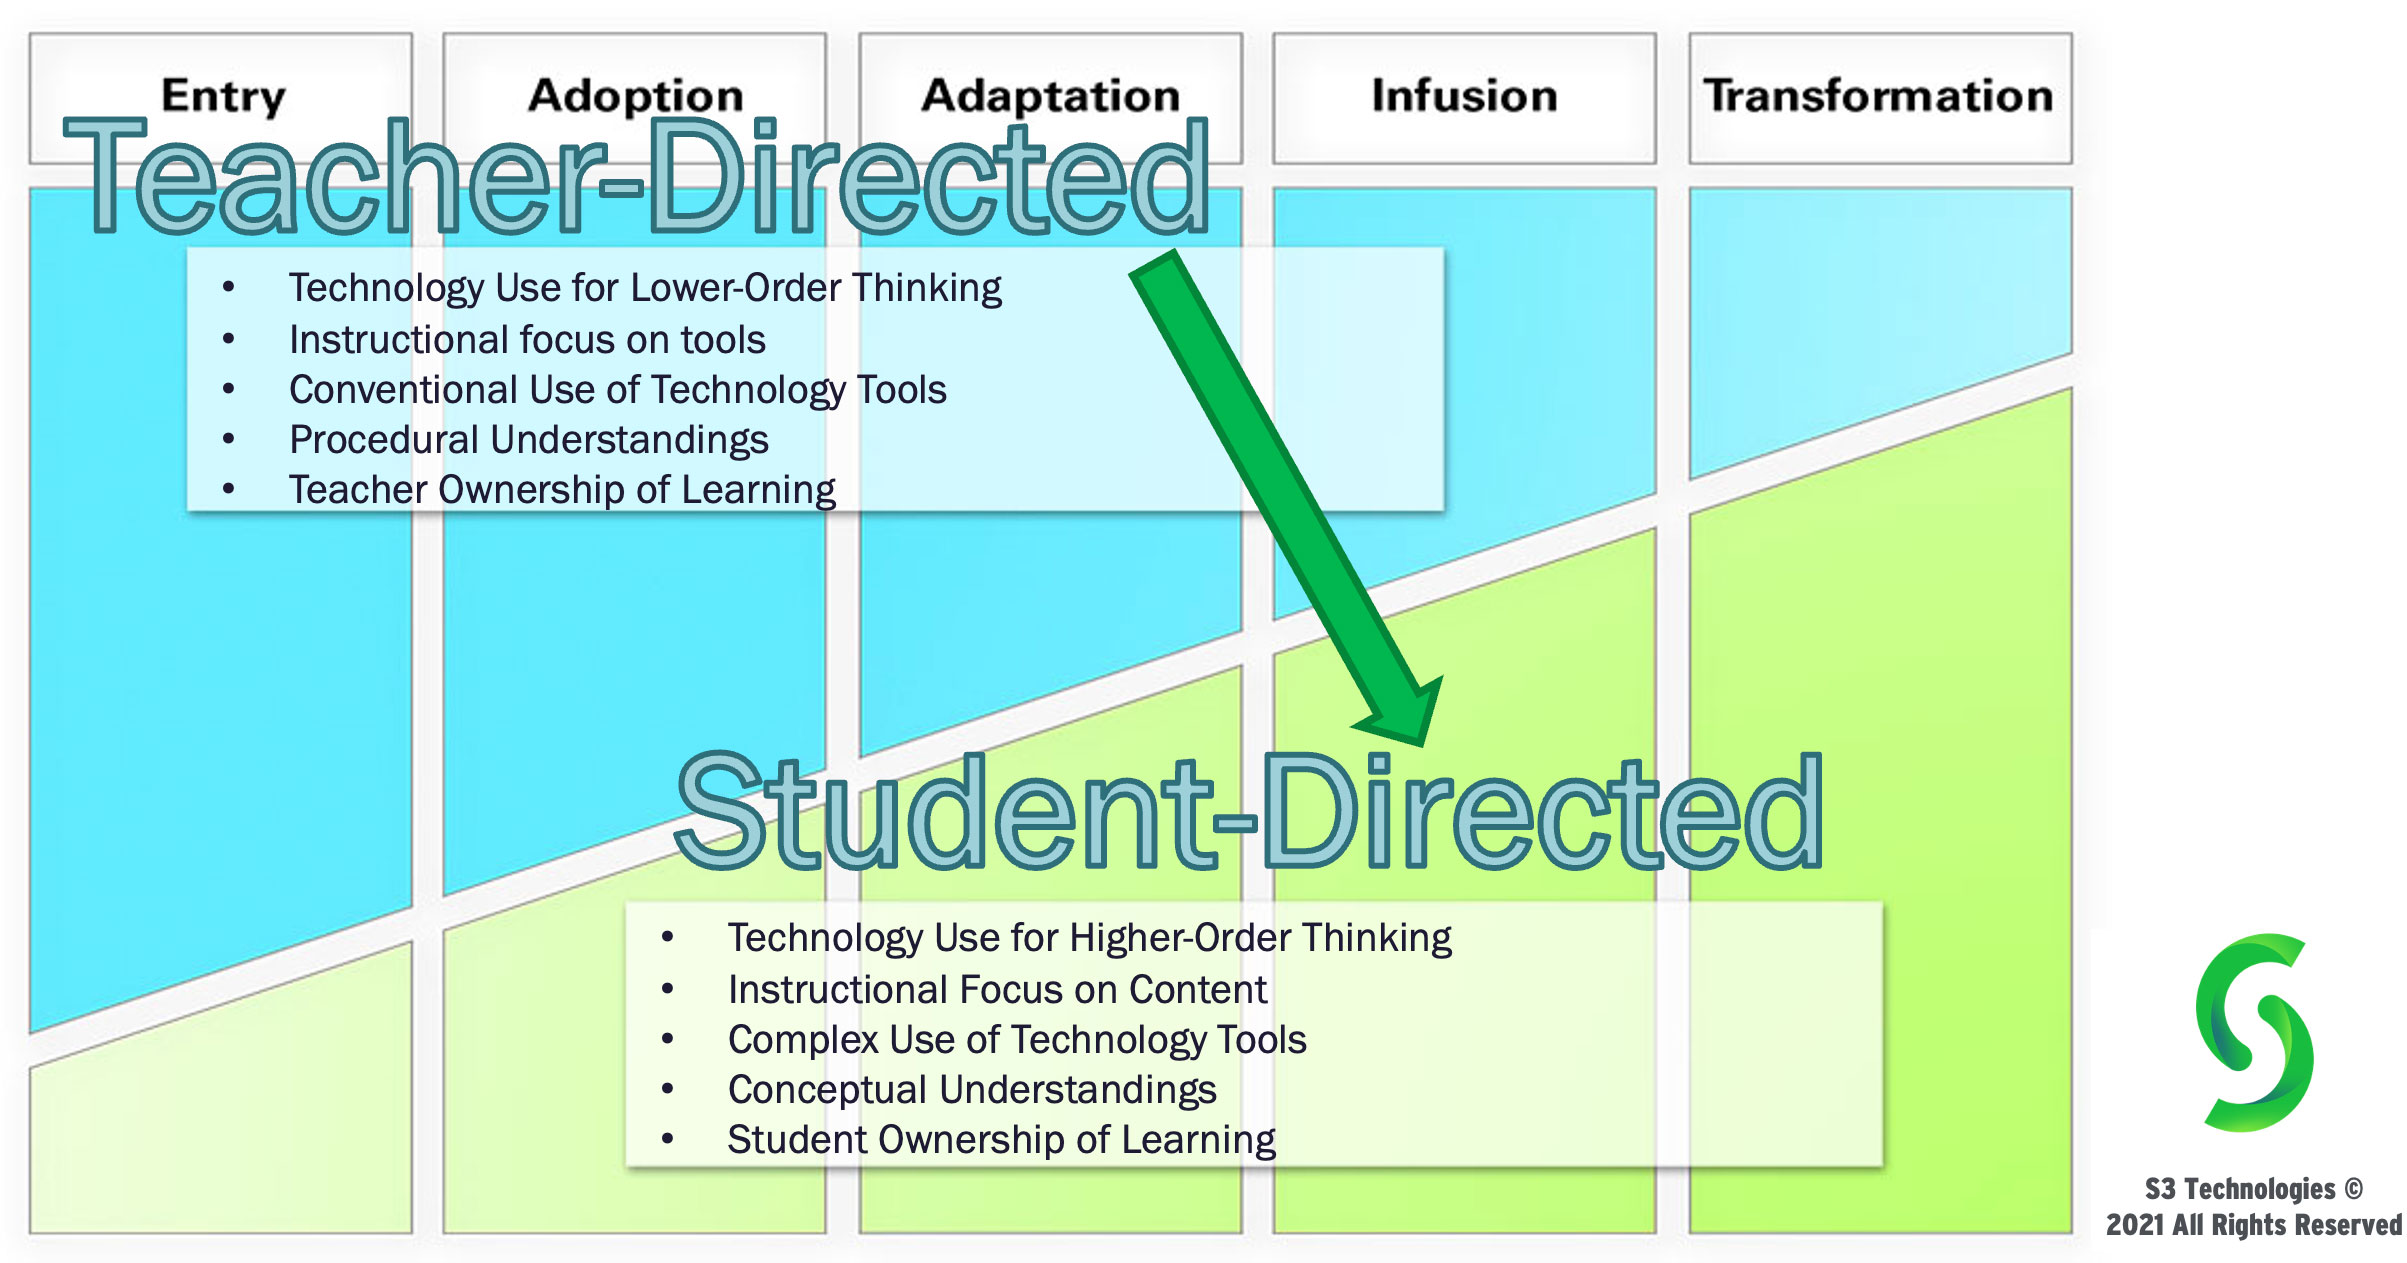
Figure 12. Shift from teacher-directed to student-directed learning. Click to enlarge.
In Figure 13, observations using the TIM-O shows significant increase in the use of technology at the adaptation level and infusion level over a two year period. This means more students were working independently with technology tools and more teachers were observed as facilitating learning without having to guide students’ technology use at every step. In addition, more students were understanding how to use a variety of technology tools and when to apply them as more teachers structured lessons to allow for flexibility in student use of those tools.
Figure 13 also shows the increased comfort level to move from entry level into the adoption and adaptation levels. For example, 40% of observations were at the entry collaborative level in 2017-2018 but only 18% were at the entry collaborative level in 2018-2019, while that same year saw growth from 30% to 44% in the adoption collaborative level and growth from 18% to 29% in the adaptation collaborative level. This means student engagement increased and supported use of tools at an individual and group level. The level of authentic adaptation also grew from 30% to 53% signaling technology tools helped students make a greater and more meaningful connection between their lesson content and their community or world around them. In short, Figure 13 demonstrates shifts in how teachers approached the design of their lessons to incorporate technology in an intentional way.
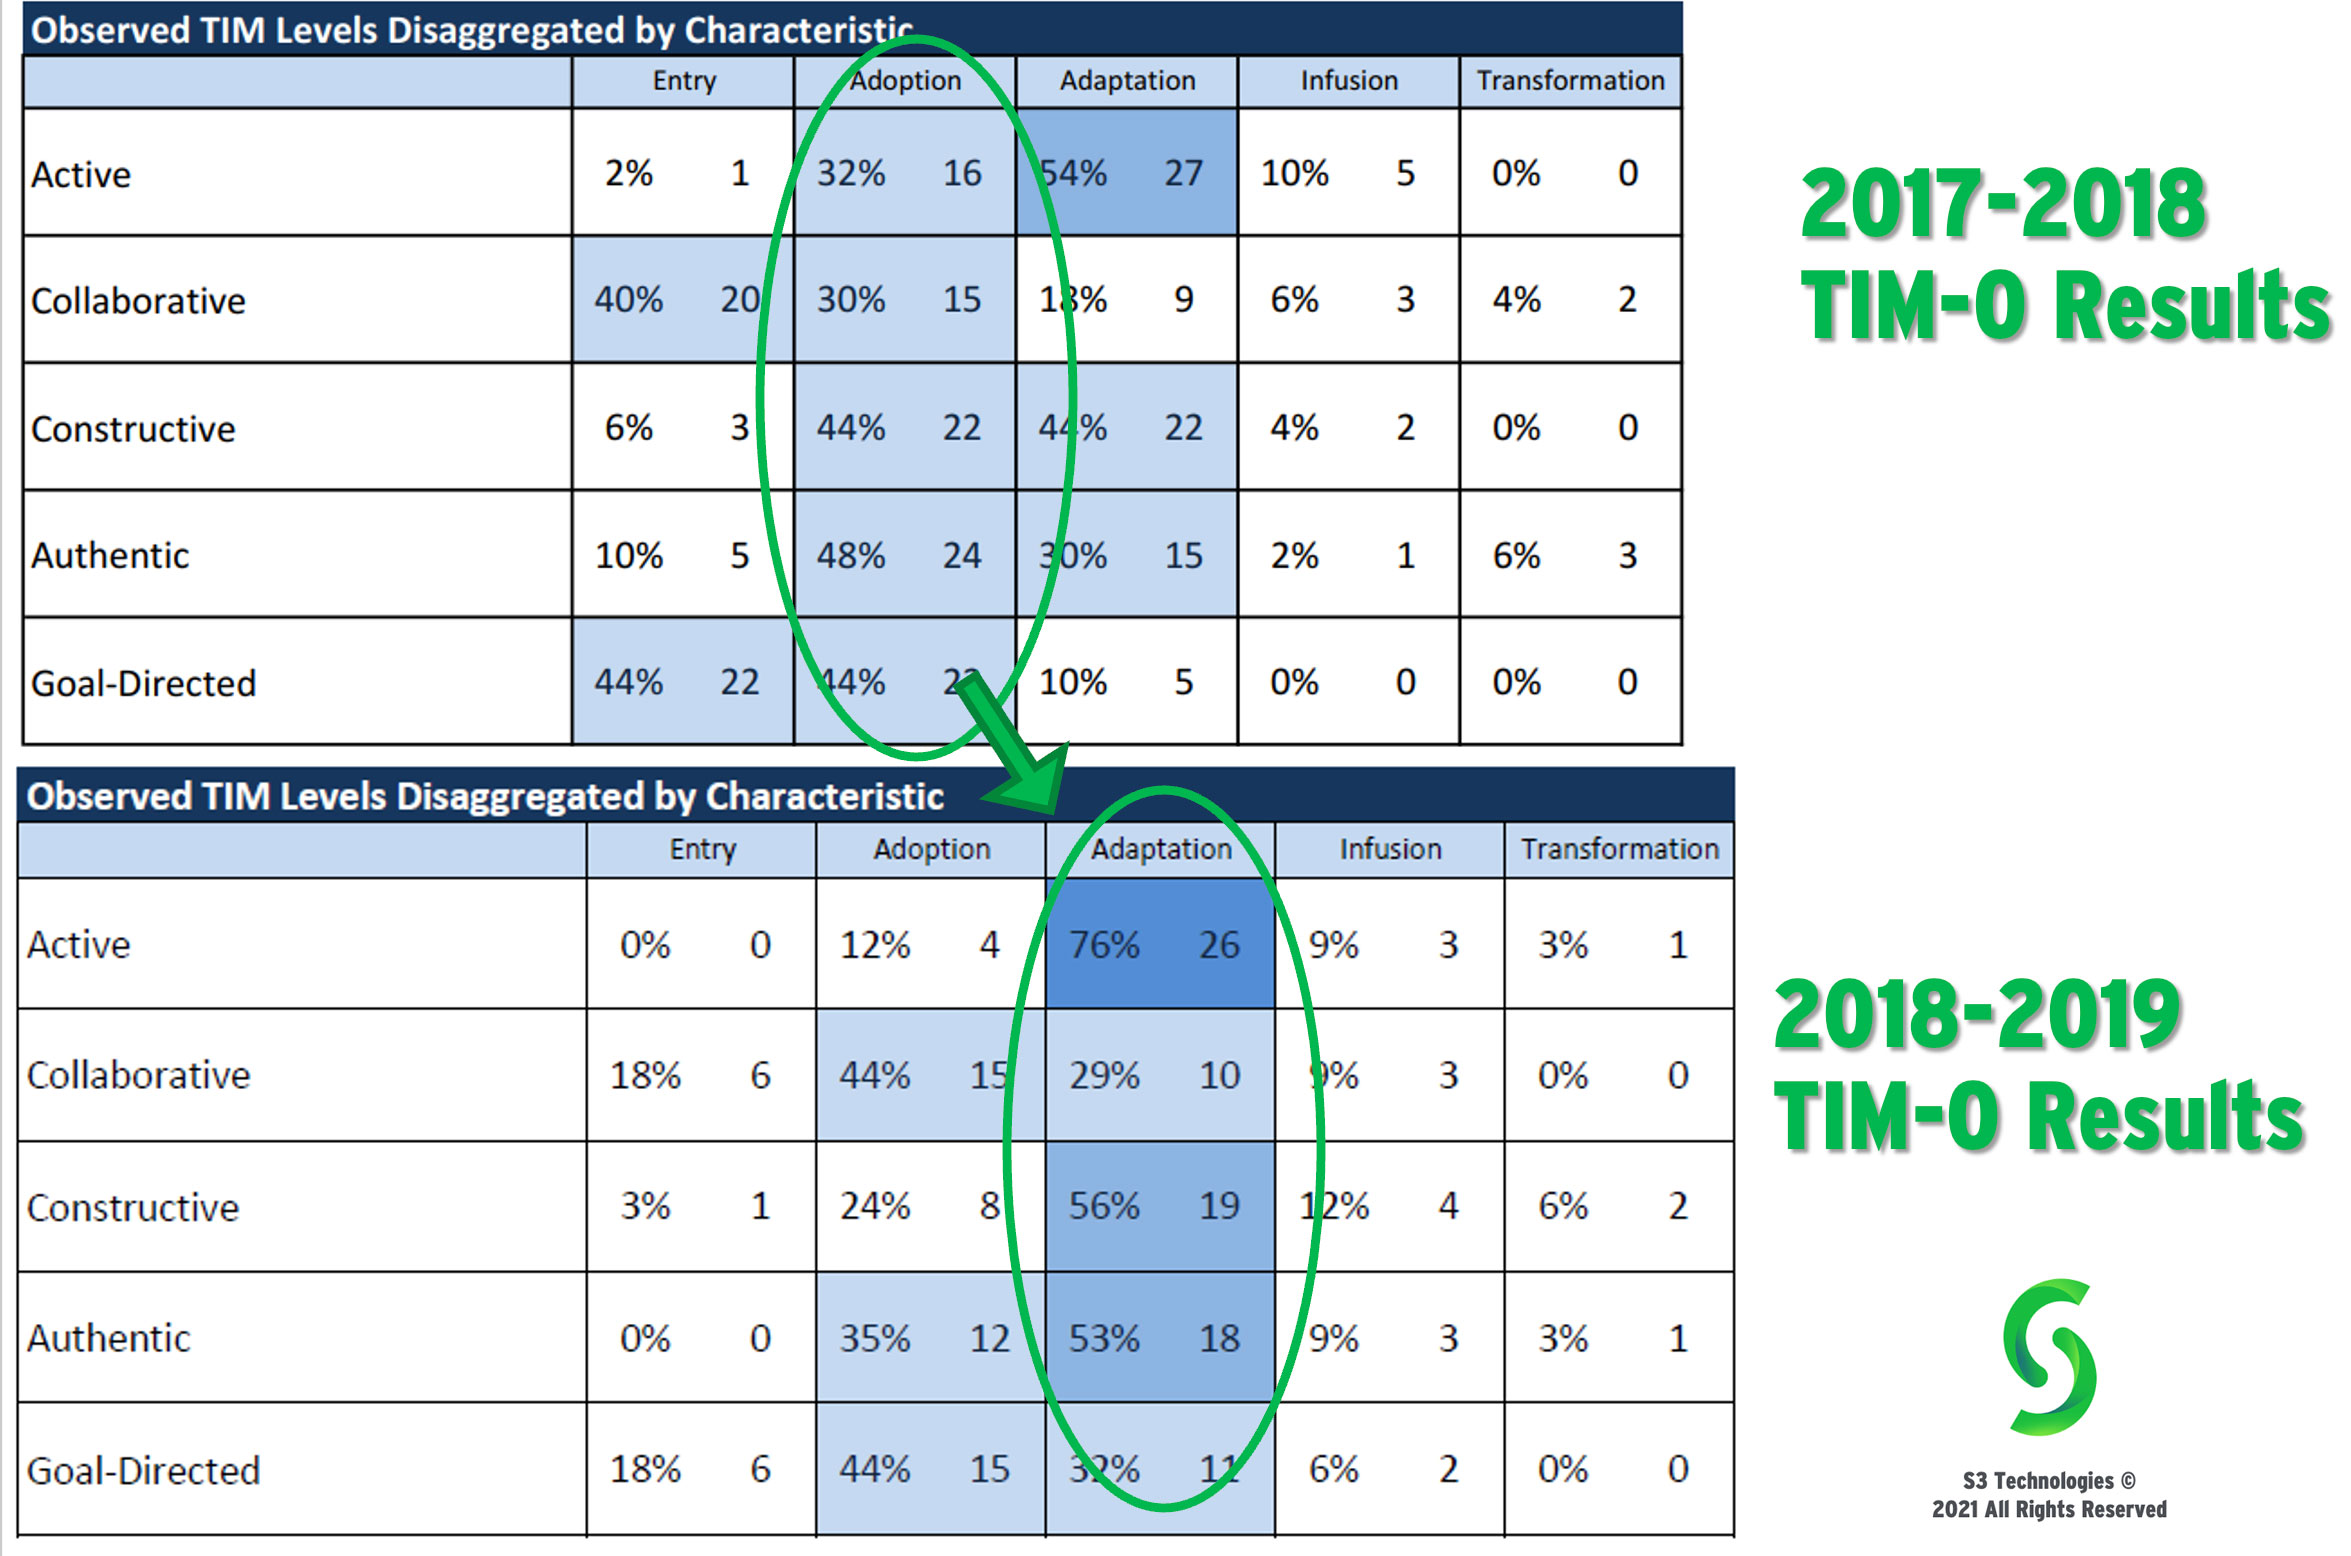
Figure 13. Summary TIM-O data. Click to enlarge.
Conclusion
Overall, the TUPS provided the data needed to create a baseline of understanding for the school administration, educators and technology decision makers to begin conversations oriented to specific areas of growth. The TIM matrix provided the common vocabulary and practical visual tools needed for educators and students to gain self-awareness on how to best utilize technology to grow student ownership in learning. The TIM descriptors of the learning environment and levels of integration provided categories that educators and students could reflect upon, to see where they were in the level of engagement and to identify where they wanted to go. The shared understanding of what technology integration looks like created an ability to look objectively at the role of technology tools and to make collaborative decisions on where to adapt and grow. The TIM approach laid a foundation for constructive feedback and increased confidence that encourages growth at a customized pace.
In 2016, St. Michael and S3 Technologies set out to improve the accuracy and depth of conversation around technology use and investments. The next several years of TIM coaching and TUPS assessment strengthened their technology use in ways they never expected. This growth is now seen as an extraordinary and timely preparation for the remote learning and online lesson needs that schools faced in 2020-2021.
Sister John Paul Maher, O.P., is the principal of St. Michael School in Worthington, OH and has taught at the high school and elementary school levels. She is a member of the Dominican Sisters of Mary, Mother of the Eucharist. Her experience includes administrative roles in strategic planning, mission advancement, information technology, non-profits, and education. In the area of educational technology, her particular interest is the use of school information systems to advance strategic growth in school communities and integrating technology in a way that serves the human person and their dignity. She is dedicated to the formation and education of young people and enjoys the study of theology, humanities, and Catholic culture.
She can be contacted at srjp@cdeducation.org, 614-885-3149 or via the Dominican Sisters of Mary Motherhouse, 4597 Warren Rd. Ann Arbor MI 48105, USA.
St. Michael School in Worthington, Ohio, is a kindergarten through eighth grade school in the Diocese of Columbus. The school incorporates an approach to student formation that includes fostering the virtue of moderation with technology use. This increases the need for strategic and intentional integration of technology to advance student learning while decreasing unnecessary screen time in young people. Academic excellence is advanced at St. Michael by using TIM Tools for technology-related decisions, to better customize instruction and professional development from TUPS data.
S3 Technologies was chosen for their knowledge of schools’ unique needs for and use of technology. The shift to partnering with an outside company to meet technology needs and to incorporate a model for educational technology was new to St. Michael. Collaboration between educators, the S3 specialists and the principal led to successful growth because of S3’s awareness that technology is a differentiated means to foster engaged, individualized, and student-driven learning. The triad of teamwork between a professional technology company, professional educators and a research-based framework for technology integration resulted in a shared accomplishment in continuity with the school’s mission and vision.
A PDF of this article may be downloaded and distributed under a Creative Commons BY-NC-ND license.