
As part of the TIM Tools suite, the Technology Integration Matrix Observation Tool, known as the TIM-O, is a framework for guiding the observation and evaluation of a lesson. It can be used for in-person, online, and hybrid lessons. When a lesson observation is completed in the TIM-O, it results in a profile for the lesson in terms of where it can be placed for each of the Characteristics of Meaningful Learning that make up the TIM (Active, Collaborative, Constructive, Authentic, and Goal-Directed). Thus for each lesson observation there is a level (Entry, Adoption, Adaptation, Infusion or Transformation) identified for each characteristic. We recommend that multiple lesson observations be conducted in each learning environment for each teacher. Once a group of teachers has received a set of lesson observations, a report can be generated that summarizes these results and calculates a set of measures that describes patterns and tendencies across the set of lesson observations for the group of teachers. This TIM-O Report and the measures it contains can serve to provide valuable insight for planning and targeting teachers’ technology-related professional development.
Last year we began a series of posts entitled “Getting the Most from your TIM Observation Data.” We wrote this series to assist you in unpacking, understanding, and making the best use of the wealth of data that comes from the TIM-O Report. We started the series with the topic of Extensity, followed by Highest Levels Observed, Flexibility, and Level Prevalence. This month we will complete the series by discussing the remaining measure in the TIM-O report, Characteristic Dominance.
Characteristic Dominance
Characteristic Dominance identifies the characteristics of meaningful learning that received the highest and lowest ratings across a set of lesson observations. This measure is calculated at the observation level, meaning that Characteristic Dominance is determined for each lesson observation and then calculated across all lesson observations in the selected dataset. Therefore all lesson observations receive an equal weight, regardless of the number of observations per teacher.
While all others measures in the TIM-O Report result in a TIM level, Characteristic Dominance identifies a characteristic of meaningful learning as its result. Characteristic Dominance is broken down into two results: the Dominant Characteristic and the Least-Dominant Characteristic.
The Dominant Characteristic is the one that most often received the highest TIM level rating. It is possible for more than one characteristic to be rated at the highest level for an observation. When this happens, we refer to it as co-dominance. The Least-Dominant Characteristic is the one that is most often rated at the lowest TIM level. Just as with the Dominant Characteristic, more than one characteristic can share the least-dominant status. Let’s view some example observation results to see what Characteristic Dominance looks like in practice.
Characteristic Dominance – Example Data
As in the previous posts, we will use the sample teacher dataset of 580 lesson observations from 413 teachers in Anytowne Schools for the time period of 08-06-2018 through 06-01-2019. Our example teachers from this dataset, Mr. Ramirez and Miss Jones, each have three lesson observations. While Characteristic Dominance is calculated and interpreted at the group level, showing how individual observation data work into the overall measure can be helpful.
First is Mr. Ramirez. Across the three lesson observations from his classroom we see a range from Adoption to Infusion. If we look at the Dominant Characteristic for each observation, we see Authentic for the first, Collaborative and Authentic are co-dominant in the second, and Authentic is dominant in the third. Thus across the set of lesson observations for Mr. Ramirez the Dominant Characteristic is Authentic. For the set of three lesson observations for Mr. Ramirez, the Least-Dominant Characteristic is actually a case where two characteristics share this status: Active and Goal-Directed.
| Mr. Ramirez Obs 1 |
Mr. Ramirez Obs 2 |
Mr. Ramirez Obs 3 |
|
| Active | Adoption | Adoption | Adoption |
| Collaborative | Adoption | Adaptation | Adaptation |
| Constructive | Adoption | Adoption | Adaptation |
| Authentic | Adaptation | Adaptation | Infusion |
| Goal-Directed | Adoption | Adoption | Adoption |
| Dominant Characteristic | Authentic | Collaborative & Authentic | Authentic |
| Least Dominant Characteristic | Active, Collaborative, Constructive, & Goal-Directed | Active, Constructive, & Goal-Directed | Active & Goal-Directed |
Next is Ms. Jones. The lesson observations from her classroom range from Entry to Adoption. Because of this small range, we find that Characteristic Dominance is shared in nearly all of the lesson observations. When looking at the group of three lesson observations for Ms. Jones, the Dominant Characteristic is a case of co-dominance with Active and Constructive. The Least-Dominant characteristic is Collaborative. Again, Characteristic Dominance is interpreted at the level of a group of observations. We are simply looking at these individual examples as an illustration.
| Ms. Jones Obs 1 |
Ms. Jones Obs 2 |
Ms. Jones Obs 3 |
|
| Active | Entry | Adoption | Adoption |
| Collaborative | Entry | Entry | Entry |
| Constructive | Entry | Adoption | Adoption |
| Authentic | Entry | Entry | Adoption |
| Goal-Directed | Entry | Entry | Adoption |
| Dominant Characteristic | All are equal | Active & Constructive | Active, Constructive, Authentic, & Goal-Directed |
| Least Dominant Characteristic | All are equal | Collaborative, Authentic, & Goal-Directed | Collaborative |
Characteristic Dominance in the Report Tool
Looking at the group of six lesson observations we find the overall Characteristic Dominance to be as follows. The Dominant Characteristic is Authentic, as it is the characteristic that was most often rated at the highest level, appearing in that position in five of the six observations. The Least-Dominant Characteristic is Goal-Directed, as it is the characteristic that was most often rated at the lowest TIM level.
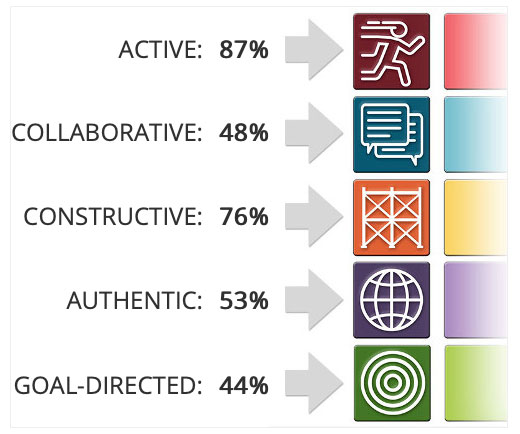
Since this small group of observations was pulled for illustrative purposes from a much larger dataset of 580 observations, let’s look at the bigger picture for making interpretations. The first graphic (below) from the TIM-O Report shows the results for the Dominant Characteristic. Here we see that the Active was the characteristic that was rated the highest in 87% of the lesson observations in this dataset. This tells us that this group of teachers is strongest in delivering lessons that involve the strategies and components of Active learning, and is least likely to benefit from PD in this area. This is followed closely by the Constructive characteristic at 76%. Note that the percentages do not add up to 100 due to the cases of co-dominance.
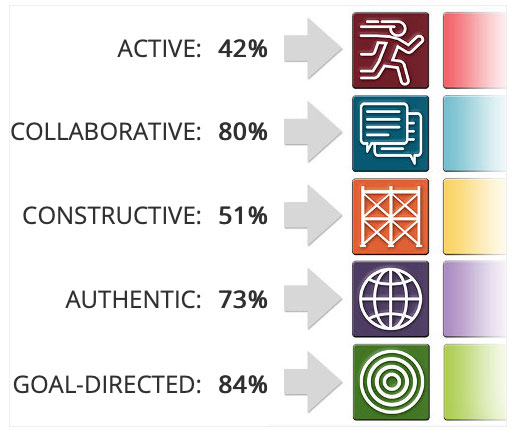
Next we see the results for the Least-Dominant Characteristic in the graphic below. This tells us which characteristic was most often rated at the lowest TIM level. For this set of lesson observations, the Least-Dominant Characteristic was Goal-Directed at 84%, followed by Collaborative at 80%. In other words, Goal-Directed was rated the lowest in 84% of the lesson observations in this set of data and Collaborative was rated at the lowest level in 80% of the lesson observations. Again, it is likely that Goal-Directed and Collaborate shared the least-dominant status in many of the observations. This information tells us that the teachers in this group are most likely to benefit from professional development that focuses on technology integration skills and applications related to Goal-Directed and Collaborative learning.
Looking at Different Groupings
Characteristic Dominance can be viewed across lesson observations for an entire school, or for meaningful groupings such as grade level or subject area. For example, we might look at all lesson observations from middle school science classrooms from the last academic year. If we see that the characteristic that was most often rated the highest was Authentic, this tells us that the middle school science department has Authentic down pretty well. If the Least-Dominant Characteristic across the lesson observations for this group is Collaborative, then we can say that this group of teachers is most likely to benefit most from technology-related professional development that focuses on Collaborative learning strategies. They are least likely to benefit from PD related to Authentic learning. Using the TIM-O Report in this way can help you save teacher time and frustration as well as school or district budgets by better targeting PD.
Summary
To wrap up, here is a brief description of the measures found in the TIM-O Report, and that have been described in detail in this series of posts.
- Extensity: the highest TIM level a teacher has demonstrated in lesson observations
- Flexibility: the TIM levels a teacher has demonstrated across lesson observations
- Highest Levels Observed: the highest TIM level for an observation across all characteristics
- Level Prevalence: the TIM level at which most lesson observations in the dataset fall
- Characteristic Dominance: the characteristics that are most often rated the highest and lowest in a set of lesson observations
As a reminder, an underlying philosophy of the TIM is that teachers should be encouraged to develop the skills to deliver a lesson at every level of the TIM. This allows them to then use the Instructional Planning Model to match the TIM level of the lesson to best meet the needs of the group of students and the curriculum. When interpreting data from any of the TIM Tools, please remember that the quality of the interpretations you make depends on the quality of the plan and data collection you implement. (For a more detailed explanation you can refer to the first post in this series.)
The TIM-O Report gives a comprehensive set of measures that can be calculated for customized groups of teachers and lesson observations. When viewed together, the resulting measures can be used to craft a data-driven plan for teacher technology professional development that makes the best use of teacher time and energy as well as school and district resources.
To reference this post using APA format:
Harmes, C. (2020, September 27). Characteristic dominance: A key to targeting professional development. [Blog post]. Retrieved from: https://fcit.usf.edu/matrix/characteristic-dominance-a-key-to-targeting-professional-development/
In This Series
- Extensity: A Teacher’s Highest Integration Level
- Highest Levels Observed: The High Watermark for an Observation
- Flexibility: A Teacher’s Range of Technology Integration Levels
- Level Prevalence: A Snapshot of Typical Teacher Classroom Technology Use
- Characteristic Dominance: A Key to Targeting Professional Development
Christine Harmes is a consultant on research, measurement, and evaluation, and an ICF-certified coach. Her research interests focus on improving teacher use of technology, computer-based testing and usability. At the Florida Center for Instructional Technology at the University of South Florida, Dr. Harmes focuses on research and tool development related to technology integration.