
Over the last few months, we have published a series of posts entitled “Getting the Most from your TIM Observation Data.” The purpose of this series is to guide you in making the best use of the data from your TIM Observations in support of targeting technology-related professional development for your teachers. The first post in the series was about Extensity, the second post focused on Highest Levels Observed, and the third post covered Flexibility. This month we will discuss one of the two remaining topics in the TIM-O report, Level Prevalence.
But first, a quick re-orientation. The Technology Integration Matrix (TIM) is comprised of five characteristics of meaningful learning: Active, Collaborative, Constructive, Authentic, and Goal-Directed. These characteristics are described at five levels of integration: Entry, Adoption, Adaptation, Infusion, and Transformation. One of the TIM Evaluation Tools is TIM Observation Tool, or TIM-O. This tool is used by an observer to evaluate a lesson and place it within the TIM. The result of an observation is a level for each of the five characteristics, as seen in the sample lesson observation summary below.
Once you have a set of multiple lesson observations for a teacher, and further, observations for a group of teachers, you can gain insights across the set of observations that will highlight strengths and target areas for development across your group of teachers. Level Prevalence is one element that provides this additional insight.
Level Prevalence
Level Prevalence identifies the most frequently occurring TIM level for each characteristic of meaningful learning. When calculating level prevalence, all lesson observations for all teachers within the selected time period are included, and each observation is a single data point. While Level Prevalence is calculated across all observations in a dataset (i.e., a value is not tabulated by teacher within a group), when viewed across a set of lesson observations for multiple teachers, it can be interpreted as the TIM level for each characteristic at which that group of teachers is most often conducting lessons. The other measures we have previously discussed result in a value or values for each teacher, or a single value for each observation. Level Prevalence gives us a value for each TIM characteristic, which can then be used to recommend characteristic-related PD for a particular group of teachers.
Let’s look at an example using the same individual teacher sample data that we have in the previous posts in this series. The complete sample dataset contains 580 observations across 413 teachers in Anytowne Schools for the time period of 08-06-2018 through 06-01-2019. Mr. Ramirez and Ms. Jones are two teachers from this dataset who each have had three lesson observations conducted in their classrooms. Please note that we are giving a Level Prevalence measure for each teacher here just as a simple illustration. In a larger dataset, Level Prevalence is not calculated by teacher before being combined with the larger group.
Our first teacher, Mr. Ramirez, delivered lessons that were generally rated as falling within the middle range of TIM levels, Adoption and Adaptation.
| Mr. R Obs 1 |
Mr. R Obs 2 |
Mr. R Obs 3 |
Level Prevalence |
|
| Active | Adoption | Adoption | Adoption | Adoption |
| Collaborative | Adoption | Adaptation | Adaptation | Adaptation |
| Constructive | Adoption | Adoption | Adaptation | Adoption |
| Authentic | Adaptation | Adaptation | Infusion | Adaptation |
| Goal-Directed | Adoption | Adoption | Adoption | Adoption |
When looking across Mr. Ramirez’s lesson observations by each characteristic, we see that the level that is most often seen for the Active, Constructive, and Goal-Directed characteristics is Adoption (all observations were at the same level). For the Collaborative and Authentic characteristics, the most commonly received rating was Adaptation. However, the range of values was different for these two characteristics. Collaborative had two occurrences of Adaptation and one of Adoption, while Authentic had two of Adaptation and one of Infusion.
Now let’s consider our second teacher, Ms. Jones. In general, most of her lesson observations were at the lower TIM levels, Entry and Adoption.
| Ms. J Obs 1 |
Ms. J Obs 2 |
Ms. J Obs 3 |
Level Prevalence |
|
| Active | Entry | Adoption | Adoption | Adoption |
| Collaborative | Entry | Entry | Entry | Entry |
| Constructive | Entry | Adoption | Adoption | Adoption |
| Authentic | Entry | Entry | Adoption | Entry |
| Goal-Directed | Entry | Entry | Adoption | Entry |
Considering these by characteristic, Collaborative, Authentic, and Goal-Directed have a Level Prevalence of Entry, while Active and Constructive are both Adoption. Again, we see different distributions within characteristics that have the same Level Prevalence.
Since Level Prevalence will most often be interpreted at the group level, the data for both teachers above are next shown in a single table below. To make it a little more interesting, we added another teacher from the same dataset, Mrs. Quint, who has one lesson observation. While there are only observations from three teachers, this will give a sense of how the lesson observation data are combined for all teachers in a particular group.
| Mr. R Obs 1 |
Mr. R Obs 2 |
Mr. R Obs 3 |
Ms. J Obs 1 |
Ms. J Obs 2 |
Ms. J Obs 3 |
Mrs. Q Obs 1 |
Level Prevalence |
|
| Active | Adoption | Adoption | Adoption | Entry | Adoption | Adoption | Entry | Adoption |
| Collaborative | Adoption | Adaptation | Adaptation | Entry | Entry | Entry | Adoption | Entry |
| Constructive | Adoption | Adoption | Adaptation | Entry | Adoption | Adoption | Adoption | Adoption |
| Authentic | Adaptation | Adaptation | Infusion | Entry | Entry | Adoption | Adoption | Adaptation |
| Goal-Directed | Adoption | Adoption | Adoption | Entry | Entry | Adoption | Adoption | Adoption |
For the set of seven observations, the Collaborative characteristic has a Level Prevalence of Entry, and the Active, Constructive, and Goal-Directed characteristics all have a Level Prevalence of Adoption. The Authentic characteristic has a Level Prevalence of Adaptation. As you can see, having only three teachers represented gives just a glimpse of how Level Prevalence works. Let’s now look at the larger dataset that these sample teachers were drawn from.
Level Prevalence in the Report Tool
The power of this measure can be seen when using the Report Tool within the TIM Tools suite. Level Prevalence is calculated at the lesson observation level, meaning that each observation in the dataset counts as one unit, regardless of the number of observations per teacher or number of teachers in the selected dataset. Remember that Mr. Ramirez, Ms. Jones, and Mrs. Quint together represent seven of the observations in the total set of 580. Let’s first look at Level Prevalence at the larger group level where we can view all characteristics in one graphic.
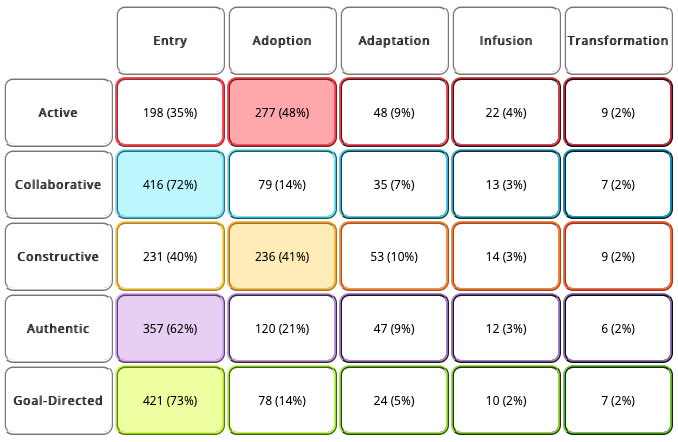
Here we see the number and percentage of lesson observations that fell within each cell of the Matrix. The cell that represents the value of Level Prevalence for each characteristic is filled in with color. By looking at this graphic we can view the Level Prevalence values for all TIM characteristics at the same time, and get a quick comparison among the characteristics. This gives us an idea of the TIM level that was typically seen across the entire set of lesson observations.
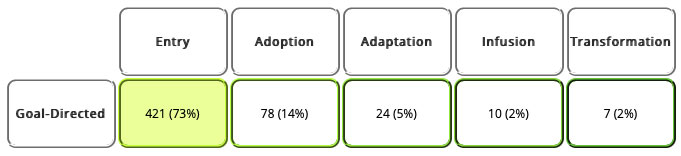
In the Report Tool, a graphic is also provided for each characteristic separately. For example, looking at just the Goal-Directed characteristic, it is clear that the majority of lessons were observed at the Entry level.
The measures we looked at in previous posts gave a single value per teacher (Extensity), a range of values per teacher (Flexibility), and a value per observation that is then collapsed across characteristics (Highest Levels Observed). Level Prevalence is unique in that it results in a value across observations for each characteristic. This allows us to pinpoint teacher technology-related professional development even more specifically in terms of instructional strategies and support. For this group of 580 teachers, professional development is most likely to be helpful in the lower to middle range of the TIM for Collaborative, Authentic, and Goal-Directed characteristics. For the Active and Constructive characteristics, PD may be most beneficial at the middle range of the TIM, and even moving into Infusion. Level Prevalence as a view of typical classroom use across a set of lesson observations can help us answer the question for each TIM characteristic, “At what level are teachers most often delivering lessons?”
To reference this post using APA format:
Harmes, C. (2020, August 29). Level prevalence: A snapshot of typical teacher classroom technology use. [Blog post]. Retrieved from: https://fcit.usf.edu/matrix/level-prevalence-a-snapshot-of-typical-teacher-classroom-technology-use/
In This Series
- Extensity: A Teacher’s Highest Integration Level
- Highest Levels Observed: The High Watermark for an Observation
- Flexibility: A Teacher’s Range of Technology Integration Levels
- Level Prevalence: A Snapshot of Typical Teacher Classroom Technology Use
- Characteristic Dominance: A Key to Targeting Professional Development
Christine Harmes is a consultant on research, measurement, and evaluation, and an ICF-certified coach. Her research interests focus on improving teacher use of technology, computer-based testing and usability. At the Florida Center for Instructional Technology at the University of South Florida, Dr. Harmes focuses on research and tool development related to technology integration.