This month we will begin a new series entitled “Getting the most from your TIM Observation Data.” A careful consideration of your TIM-O data will give you a deeper understanding of the technology-related strengths and needs of your teachers so you can more effectively target their professional development. Each month, we will focus on a different measure from the TIM-O data. This month, our topic is Extensity.
The Report Tool
So you have done observations in the classrooms across your district, but how can you best use this valuable data? The Report Tool within the TIM Tools suite offers a rich set of analyses that will give you different views of the data so that you can answer the questions aligned with your purpose.
You will likely want to look at the observation data at both the individual and group levels.
At the individual teacher level, TIM-O data is great for identifying where on the matrix a teacher’s lessons tend to be categorized. You can then know how to best support that teacher in enhancing his or her instructional practice related to technology. Observation results can be great material for coaching and for professional development planning.
Using data at the school or district level is more complex.* Therefore, we created a set of concepts and related measures within the Report Tool to help you get a more detailed understanding of your TIM-O data from the group-level perspective. Please note that taking a simple arithmetic average is NOT appropriate for this type of data! The measures we provide instead, will give you richer, more powerful information.
The concepts included in the TIM-O report are: Extensity, Flexibility, Level Prevalence, Highest Levels Observed, and Characteristic Dominance.
Extensity
This month I’ll focus on Extensity, and go through a couple of examples to illustrate this measure. We define Extensity as the highest TIM level seen for a given teacher across all characteristics and observations.
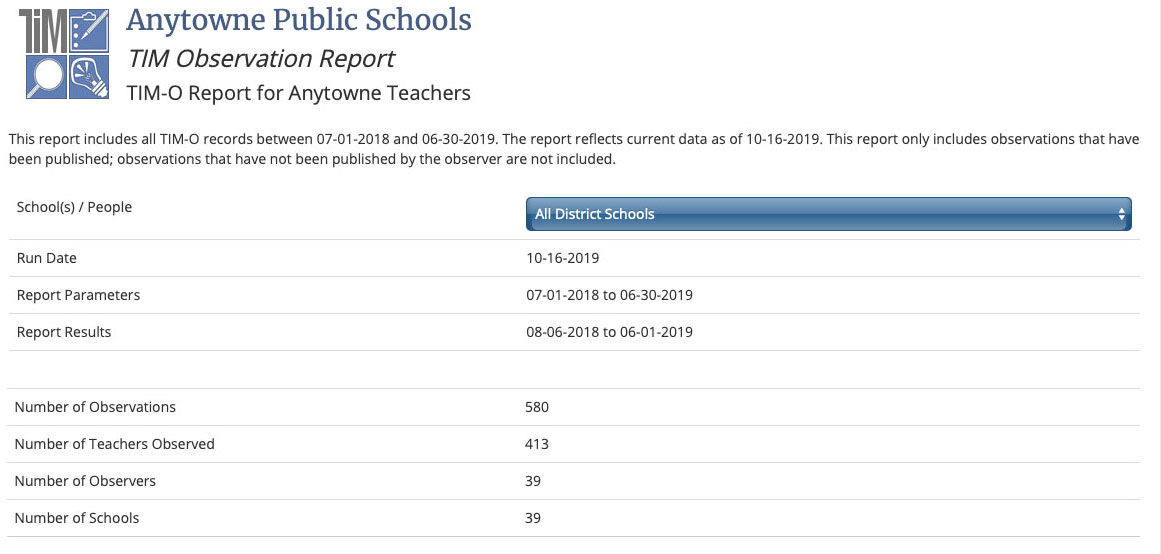
Figure 1. A district-wide report for the 2018-19 academic year.
In the example dataset, there are 580 observations across 413 teachers in Anytowne Schools for the time period of 08-06-2018 through 06-01-2019. The graph provided shows you the Teacher Extensity Distribution calculated from this dataset. This distribution includes one value for each teacher. This value is the highest TIM level that was observed for that teacher across all observations and characteristics over the specified time period.
Let’s look at a couple of example teacher records to show this more clearly.
Mr. Ramirez
| Observation 1 | Observation 2 | Observation 3 | |
| Active | Adoption | Adoption | Adoption |
| Collaborative | Adoption | Adaptation | Adaptation |
| Constructive | Adoption | Adoption | Adaptation |
| Authentic | Adaptation | Adaptation | Infusion |
| Goal-Directed | Adoption | Adoption | Adoption |
We can see that the highest level that was seen across all three lessons observed for Mr. Ramirez was Infusion for the Authentic characteristic in the third observation. Therefore, the Extensity value assigned to Mr. Ramirez is Infusion. This does not mean that Infusion is necessarily the highest level that Mr. Ramirez has ever reached in a lesson, or the highest level that he is capable of demonstrating. It is the highest level that was seen across the three lessons that were observed over the time period. The more observations that are conducted for each teacher, the more confidence you can have that the Extensity value represents a teacher’s capabilities when using technology in his or her teaching.
Another teacher in the dataset is Ms. Jones.
| Observation 1 | Observation 2 | Observation 3 | |
| Active | Entry | Adoption | Adoption |
| Collaborative | Entry | Entry | Entry |
| Constructive | Entry | Adoption | Adoption |
| Authentic | Entry | Entry | Adoption |
| Goal-Directed | Entry | Entry | Adoption |
From this data we see that the Extensity value for Ms. Jones is Adoption. Now let’s look again at the bigger picture to see how these two teachers would be seen within the overall Extensity distribution.
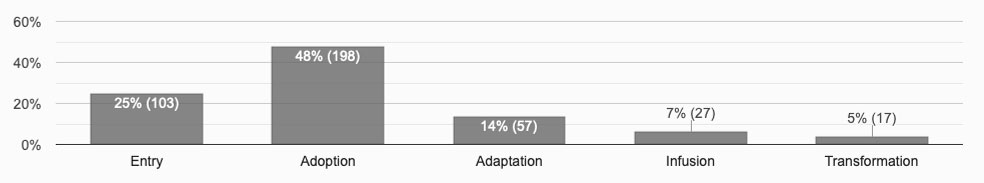
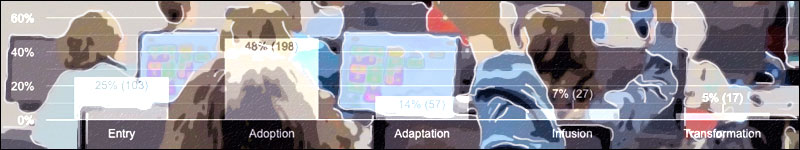
Figure 2.
The graph helps us answer the question of How many teachers have demonstrated lessons that reach each TIM level (as their highest level)? In this dataset, the highest level observed across all characteristics within all observations was Entry for 25% of the teachers. The highest level reached was Adoption for 48% of the teachers, which includes Ms. Jones. Adaptation was the highest level for 7% of the teachers, and Infusion was the highest level for 7% of the teachers, including Mr. Ramirez. Finally, 5% of the teachers reached the Transformation level for at least one of the TIM characteristics across all of the observations that were conducted in their classrooms.
How can you best use this Extensity distribution? It is especially powerful for planning professional development and for setting school or district-wide goals. For example, since almost half of their teachers have reached an Extensity level of Adoption, Anytowne Schools may decide to set a goal for the 2019-2020 school year that each teacher will demonstrate a lesson that has at least one TIM characteristic at the Adaptation level or higher. To support this goal, they will focus their professional development efforts on strategies for using technology at the Adaptation level. Or, they may decide to focus their goals on both the Adoption and Adaptation levels, supporting their teachers in expanding their range to Adoption and Adaptation as appropriate.
It is important to remember that effective teachers will match the TIM level to their students’ needs and curriculum demands, and will likely implement lessons at various TIM levels, as appropriate. Extensity gives you a view of the upper limits of the pedagogical range within which teachers are implementing technology in their classrooms, and can help you direct your support to best meet their needs.
*Although it goes without saying, I’ll say it anyway. The trustworthiness of the conclusions you draw from the data—particularly at the school or district level— depends on the design and rigor of your data collection. For the analyses provided, we assume that: 1. The observers were trained on how to conduct classroom observations, 2. The observers applied the criteria in the same way across observations (they used the TIM-O consistently across classrooms and over time), and 3. The observations were conducted over the same time period (within the same semester, same school year, or other distinct period of time).
In This Series
- Extensity: A Teacher’s Highest Integration Level
- Highest Levels Observed: The High Watermark for an Observation
- Flexibility: A Teacher’s Range of Technology Integration Levels
- Level Prevalence: A Snapshot of Typical Teacher Classroom Technology Use
- Characteristic Dominance: A Key to Targeting Professional Development
Christine Harmes is a consultant on research, measurement, and evaluation, and an ICF-certified coach. Her research interests focus on improving teacher use of technology, computer-based testing and usability. At the Florida Center for Instructional Technology at the University of South Florida, Dr. Harmes focuses on research and tool development related to technology integration.