
Several months ago we started a new series entitled “Getting the Most from your TIM Observation Data.” The purpose of this series is to help you leverage the data from TIM Observations so that you can gain a deeper understanding of the technology-related strengths and needs of your teachers, and more effectively target their professional development. The first post in this series was about Extensity, the second post focused on Highest Levels Observed. This month, our topic is Flexibility.
Flexibility
In the context of technology integration, we are using the term Flexibility to refer to a teacher’s ability to deliver a lesson at each TIM level for each characteristic of meaningful learning. This provides a view of the range within which your teachers have been observed delivering technology-infused lessons.
Teacher flexibility is different from teacher extensity in that extensity looks only at the highest level observed across a teacher’s observations, whereas flexibility includes all levels observed for all characteristics across all observations of each teacher, and then summarizes across all teachers.
To help illustrate the differences between the concepts found in the TIM-O Report, we will use the same dataset and individual teacher examples as we have in previous posts. As a reminder, the sample dataset we are using is contains 580 observations across 413 teachers in Anytowne Schools for the time period of 08-06-2018 through 06-01-2019.
First, we have Mr. Ramirez. Here are the data from observations conducted in his classroom during the specified time period:
| Observation 1 | Observation 2 | Observation 3 | |
| Active | Adoption | Adoption | Adoption |
| Collaborative | Adoption | Adaptation | Adaptation |
| Constructive | Adoption | Adoption | Adaptation |
| Authentic | Adaptation | Adaptation | Infusion |
| Goal-Directed | Adoption | Adoption | Adoption |
We can see that overall Mr. Ramirez has demonstrated three levels from Adoption to Adaptation to Infusion. Looking at each characteristic individually, his range is a single level (Adoption) for both the Active and Goal-Directed characteristics. For Collaborative, he had lessons observed at the Adoption and Adaptation levels. For Authentic, he had lessons observed at Adaptation and Infusion. So we can see that Mr. Ramirez has demonstrated lessons that span the mid-range of the TIM levels, but not the bottom or top levels. It is highly likely that Mr. Ramirez is quite capable of conducting a lesson at the Entry level, but was not observed doing so. Professional development for Mr. Ramirez is probably best focused on the upper levels of the TIM across all characteristics.
The second teacher we looked at in the previous posts was Ms. Jones. Here are the data from observations in her classroom for the selected time period:
| Observation 1 | Observation 2 | Observation 3 | |
| Active | Entry | Adoption | Adoption |
| Collaborative | Entry | Entry | Entry |
| Constructive | Entry | Adoption | Adoption |
| Authentic | Entry | Entry | Adoption |
| Goal-Directed | Entry | Entry | Adoption |
From this table we see that Ms. Jones has demonstrated an overall range of Entry to Adoption. In fact, when looking individually at the characteristics of learning, that same range is present across the Active, Constructive, Authentic, and Goal-Directed characteristics. Collaborative is the only place we see a single level, Entry. This tells us that Ms. Jones has demonstrated lessons at the lower levels of the TIM across all characteristics, and is likely to benefit from professional development focused on moving to the Adaptation level, in general, with specific focus on the Adoption level for the Collaborative area.
Using the Report Tool to View Flexibility at the Group Level
As introduced in our earlier posts, the Report Tool within the TIM Tools suite offers a rich set of analyses that will give you different views of the dataset. These various approaches to looking at your data can give you a more complete picture of the technology integration that is happening in the classrooms in your school or district. As a reminder, the concepts included in the TIM-O Report are: Extensity, Flexibility, Level Prevalence, Highest Levels Observed, and Characteristic Dominance.
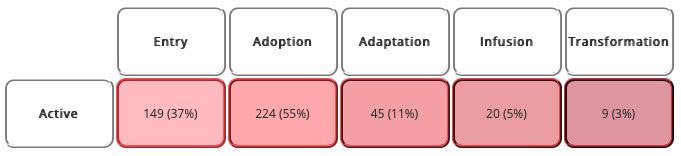
Flexibility data can be especially powerful when viewed at the group level. When combining data across observations and teachers for the selected time period, the observations are first collapsed by teacher for each TIM characteristic. You can see a summary view of each characteristic separately, as in the first graphic below. So, for example, in this summary graphic of the Active characteristic Mr. Ramirez would be counted as one of the 224 total for Adoption, since all three of his observations were at the Adoption level for Active. However, since Ms. Jones’s lesson observations were at different levels for the Active characteristic, the first would be counted as one of the 149 total for Entry and the second and third would be counted as one of the 224 total for Adoption.
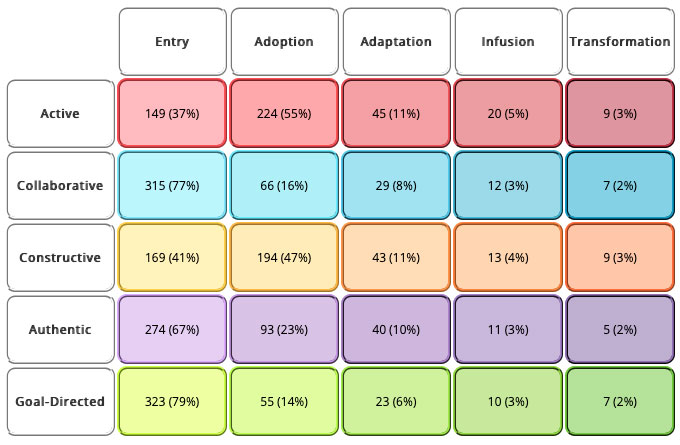
In addition to individual characteristic summaries, the TIM-O Report provides one large graphic that encompasses all five characteristics (see below). This allows you to quickly scan and compare the flexibility range of your teachers across all characteristics at once. Here we can quickly see that the range covers all TIM levels for all characteristics. The distributions of numbers of teachers is similar across most characteristics, the Active and Constructive characteristics have higher concentrations in Adoption rather than Entry. This might indicate that specific professional development could be helpful in the Collaborative, Authentic, and Goal-Directed characteristics to start.
The most condensed version of the data is provided in the summary table below, Teacher Flexibility Distribution. This table answers the question “How many teachers have demonstrated lessons at each of the TIM levels for at least one characteristic? Here I emphasized the “at least” phrase, because it explains why the numbers in this table are different from a simple summation down each column in the graphic above. Let’s look back at the data from our example teachers. In the first observation, Mr. Ramirez hit the Adoption and Adaptation levels. In the second observation, he reached the same two levels, although they were distributed differently. In the third observation he had Adoption, Adaptation, and a new level, Infusion. Therefore in the summary table, Mr. Ramirez would be counted as one for Adoption, one for Adaptation, and one for Infusion since he demonstrated lessons that reached each of those three levels for at least one characteristic across all of the observations in his classroom. Similarly, Ms. Jones would be counted in this table as one for Entry and one for Adoption.
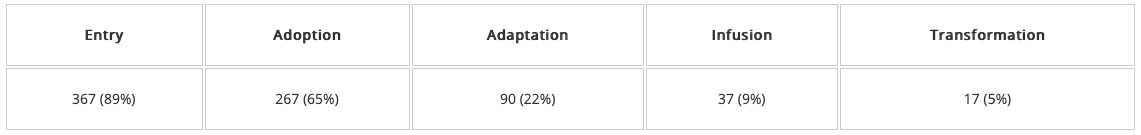
The distribution of teacher flexibility incorporates ratings from all observations of all teachers in the selected dataset. For example, if every teacher demonstrated lessons that had at least one characteristic rated at the Adoption level, the summary value for Adoption would be 100%.
Ideally, teachers would be able to deliver a lesson at every TIM level so that they are then able to target the level of integration that is most appropriate for a given lesson and group of students. The concept of Flexibility gives us an indication of the degree to which this has been demonstrated for each teacher, and then at the group level, how well this has been demonstrated across the entire set of teachers. As always, please remember that the quality of the conclusions you make depends on the quality of the design and data collection you employ (if you would like more detail on this, please see the first post in this series).
By using the concepts we have covered to this point, Extensity, Highest Levels Observed, and Flexibility, you now have a powerful set of analyses to consider together when making decisions about teacher professional development in technology integration.
To reference this post using APA format:
Harmes, C. (2020, January 30). Flexibility: A teacher’s range of technology integration levels. [Blog post]. Retrieved from: https://fcit.usf.edu/matrix/flexibility/
In This Series
- Extensity: A Teacher’s Highest Integration Level
- Highest Levels Observed: The High Watermark for an Observation
- Flexibility: A Teacher’s Range of Technology Integration Levels
- Level Prevalence: A Snapshot of Typical Teacher Classroom Technology Use
- Characteristic Dominance: A Key to Targeting Professional Development
Christine Harmes is a consultant on research, measurement, and evaluation, and an ICF-certified coach. Her research interests focus on improving teacher use of technology, computer-based testing and usability. At the Florida Center for Instructional Technology at the University of South Florida, Dr. Harmes focuses on research and tool development related to technology integration.