
Last month we looked at the use of Excel Templates. This month we’ll consider what can be done simply within Excel itself to review data or to filter it for later use in the TUPS Data Analysis Template.
Sorting
Looking around. It never hurts to take a moment to poke around your TUPS download spreadsheet. Just doing some very basic sorts will reveal answers to questions such as:
- How many responses are included from each framework you selected?
- Sorting by school or zone will allow you to compare response rates.
- How many responses are from each role? Is there a role that is lagging in survey submissions?
- If you downloaded “All” rather than “Submitted” surveys, what percentage of the surveys are complete and submitted?
- Sorting by school or zone will allow you to compare response rates.
- Sort by dates to see when members last edited a survey.
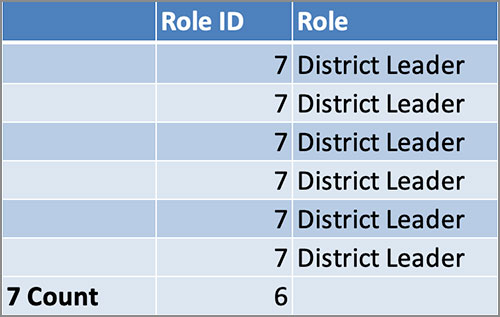
Tip: If you want to see how many of each category you have in columns such as Subjects or Role, sort and then turn on Subtotal.
Tidying up. TIM Tools downloads provide “clean” data that can easily be imported into other statistical software packages or the provided Excel templates. Depending on what you plan to do with the data next, you may want to tidy up the four columns of the TUPS that allow for the entry of free text. In some cases, you might want to collapse some of the “Other” columns entries back into the defined choices. Here are the columns to examine:
Ethnicity Other Box
Degree Other Box
Subjects Other Box
Grades Other Box
For example, if you plan to do more analysis by broad subject area categories, you may wish to change the response of a teacher who indicated “Other” and added Band as her subject back to the broad response of Art/Music. Or perhaps you simply want to add a bit of standardization to the Other column. You might have some teachers adding “Theatre” as a subject area and others adding “Theater.”
Sorting any of the four “Other” columns by Z to A will bring all the write-in responses to the top for review. A single period in a cell indicates no response to the item.
There probably won’t be many items to “tidy up,” so it won’t take long to handle them before you start analyzing the data.
Filtering for Further Use in the TUPS Analysis Template
As I mentioned last month, there are a number of parameters you can set when you do your original TUPS data download. These include:
Whether the survey has been submitted or not
All frameworks or just one specific framework
All schools, just one zone, or just one school
What role or combination of roles you want included
Whether the data is to be anonymized or not
Date range of responses
Those choices will fit most needs, but what if you want to filter by some parameter that the downloader doesn’t offer? Maybe you want to look at data from only Math teachers, or teachers with advanced degrees, or with less than ten years teaching experience? For that, you’ll need to apply a bit of filtering to your downloaded data. Sorting just rearranges the rows. Filtering hides the rows you aren’t interested in. You can then copy the filtered data and paste it into a fresh spreadsheet to import into the analysis template.
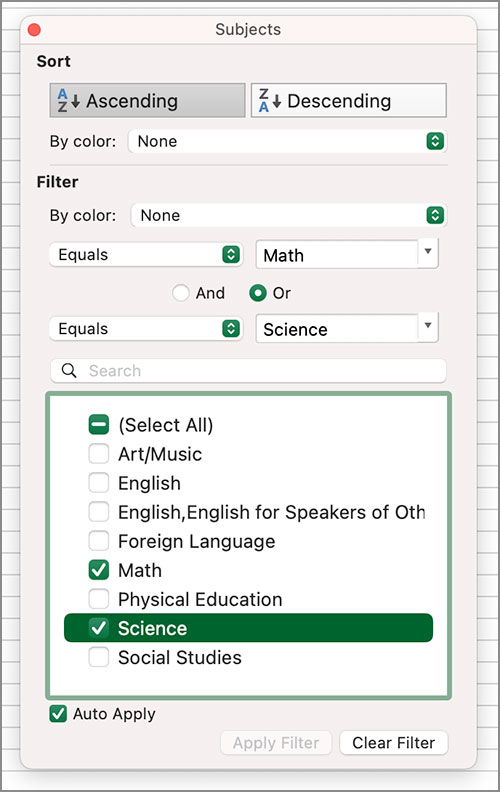
Let’s say I just want to look at TUPS results for Math and Science teachers. There’s no Subject parameter setting when downloading TUPS data, so I’ll download the data for all subjects and then filter down to just Math and Science teachers. The adjacent illustration shows you what the filtering panel would look like to filter for those two subject areas.
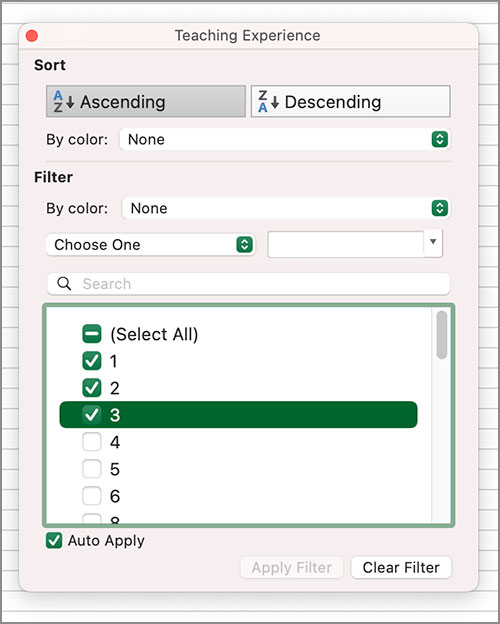
Ah, but I’m especially interested in our newer teachers, so in addition to the Subject filter, I’ll add an additional filter to select only those Math and Science teachers with one, two, or three years teaching experience. I can continue to add filters until I’ve narrowed my data down to include just the respondents I want.
You can also use filtering to create two or more different groups for comparison purposes. I was recently working with TUPS data from a K-12 private school that has separate upper and lower school campuses. I filtered by grade level to create two new spreadsheets. One spreadsheet contained the TUPS results from K-6 teachers and a second spreadsheet contained the results from grades 7-12 teachers. I then imported each into a copy of the TUPS Data Analysis Template.
Wow! Even though both groups of teachers were from the same school, there were striking differences in their TUPS responses that indicated entirely different professional development, technology, and support needs between the two campuses. It was apparent that even some minor reallocation of existing resources could have a major impact on technology integration. The comparison also revealed many areas in which expertise at one campus could benefit the other. One example that jumped out at me was the use of concept mapping software. The largest group of lower school teachers indicated that they thought both the usefulness of the software and their skill levels were “very high.” The largest group at the upper school responded “none” to both the usefulness and skill questions. I’d like to arrange a show-and-tell between the two campuses!
Filtering TUPS results can also help match teachers and peer coaches on the use or integration of 32 different technologies. Here are two possible sets of filters you could apply. One set will yield a list of teachers who would be willing and able to coach another teacher on the use of video editing software. The second set yields a list of teachers who need and would really appreciate that coaching.
Ready To Mentor
I can help others solve technology problems: Agree or Strongly agree
I am prepared to guide other teachers in planning and implementing lessons that incorporate technology: Agree or Strongly agree
Teacher use of video editing technology: Several times per week, Every day, or Multiple times per day
Student use of video editing technology: Several times per week, Every day or Multiple times per day
Teacher skill level in video editing technology: High or Very high
Teacher’s perception of usefulness of video editing technology: High or Very high
Ready To Be Mentored
More training would increase my use of technology in my teaching. Agree or Strongly agree
To what extent do you think the following types of technology-related professional development would be beneficial to you? Training on applications used by students: To a great extent or Entirely
Teacher use of video editing technology: Not at all or Once per month or less
Student use of video editing technology: Not at all or Once per month or less
Teacher skill level in video editing technology: None, Very low, or Low
Teacher’s perception of usefulness of video editing technology: High or Very high
Sorting and filtering in this way can lead to effective pairing of coaches and clients when using the TIM-C Coaching Tool, or just creating a list of teacher tech experts by software type. Each of our schools has teachers with expertise that is never seen beyond their own classrooms. Your TUPS data can help you leverage their expertise and experience to provide quality peer coaching throughout your district. And that’s in addition to the insights the TUPS Data Analysis Template provides regarding your faculty’s perceptions of their tech access and support; their comfort and confidence using technology; their integration methods; and their skills, use, and perceptions of usefulness to a whole range of technologies. My favorite section of the TUPS Data Analysis Template is the Quadrant Graph. See the list below for other ways to use TUPS data.
Index of TUPS Articles
- Using TUPS Collection Frameworks
- How often should we administer the TUPS?
- Using the TUPS to Target Professional Development
- Nail Your Next Tech PD with the Quadrant Graph
- Working with TUPS Data: The First Read-Through
- Using TUPS Data: Individual Items
- TUPS and Excel
- Find the Coaches Hiding in Your TUPS Data
Roy Winkelman is a 40+ year veteran teacher of students from every level kindergarten through graduate school. As the former Director of FCIT, he began the Center's focus on providing students with rich content collections from which to build their understanding. When not glued to his keyboard, Dr. Winkelman can usually be found puttering around his tomato garden in Pittsburgh.