
Administrators of TIM Tools sites can view their data four different ways:
- Using the built-in Report Tool
- Downloading raw data and importing into their own statistical software
- Using an API
- Downloading and importing into a TIM Tools template
It’s the template option that I’d like to discuss today. We’ve created Excel templates to help you analyze your data from the TUPS, TIM-O, TIM-R, TIM-LP, and TIM-C. Each of the five templates can be downloaded from the TIM Tools Report Templates page. These templates will work with data downloaded from TIM Tools version 7. If you have old TUPS or TIM-O data sets that you downloaded from previous versions, you should go to the TUPS or TIM-O archive page to find the appropriate template for data in older formats.
Three Steps To Using TIM Tools Templates
1. Download (and Save) Your Raw Data
Go to the Admin Center within TIM Tools and select the specific tool you want the data for. Each download area provides options for setting parameters if you don’t want to download the entire data set. For example, the TUPS downloader allows a choice of all surveys or only submitted surveys, frameworks, schools, roles, date range, and whether you want the data anonymized. Once you’ve made your choices, just click the Download button and save the Excel file in a convenient location. (Click adjacent image to expand.)

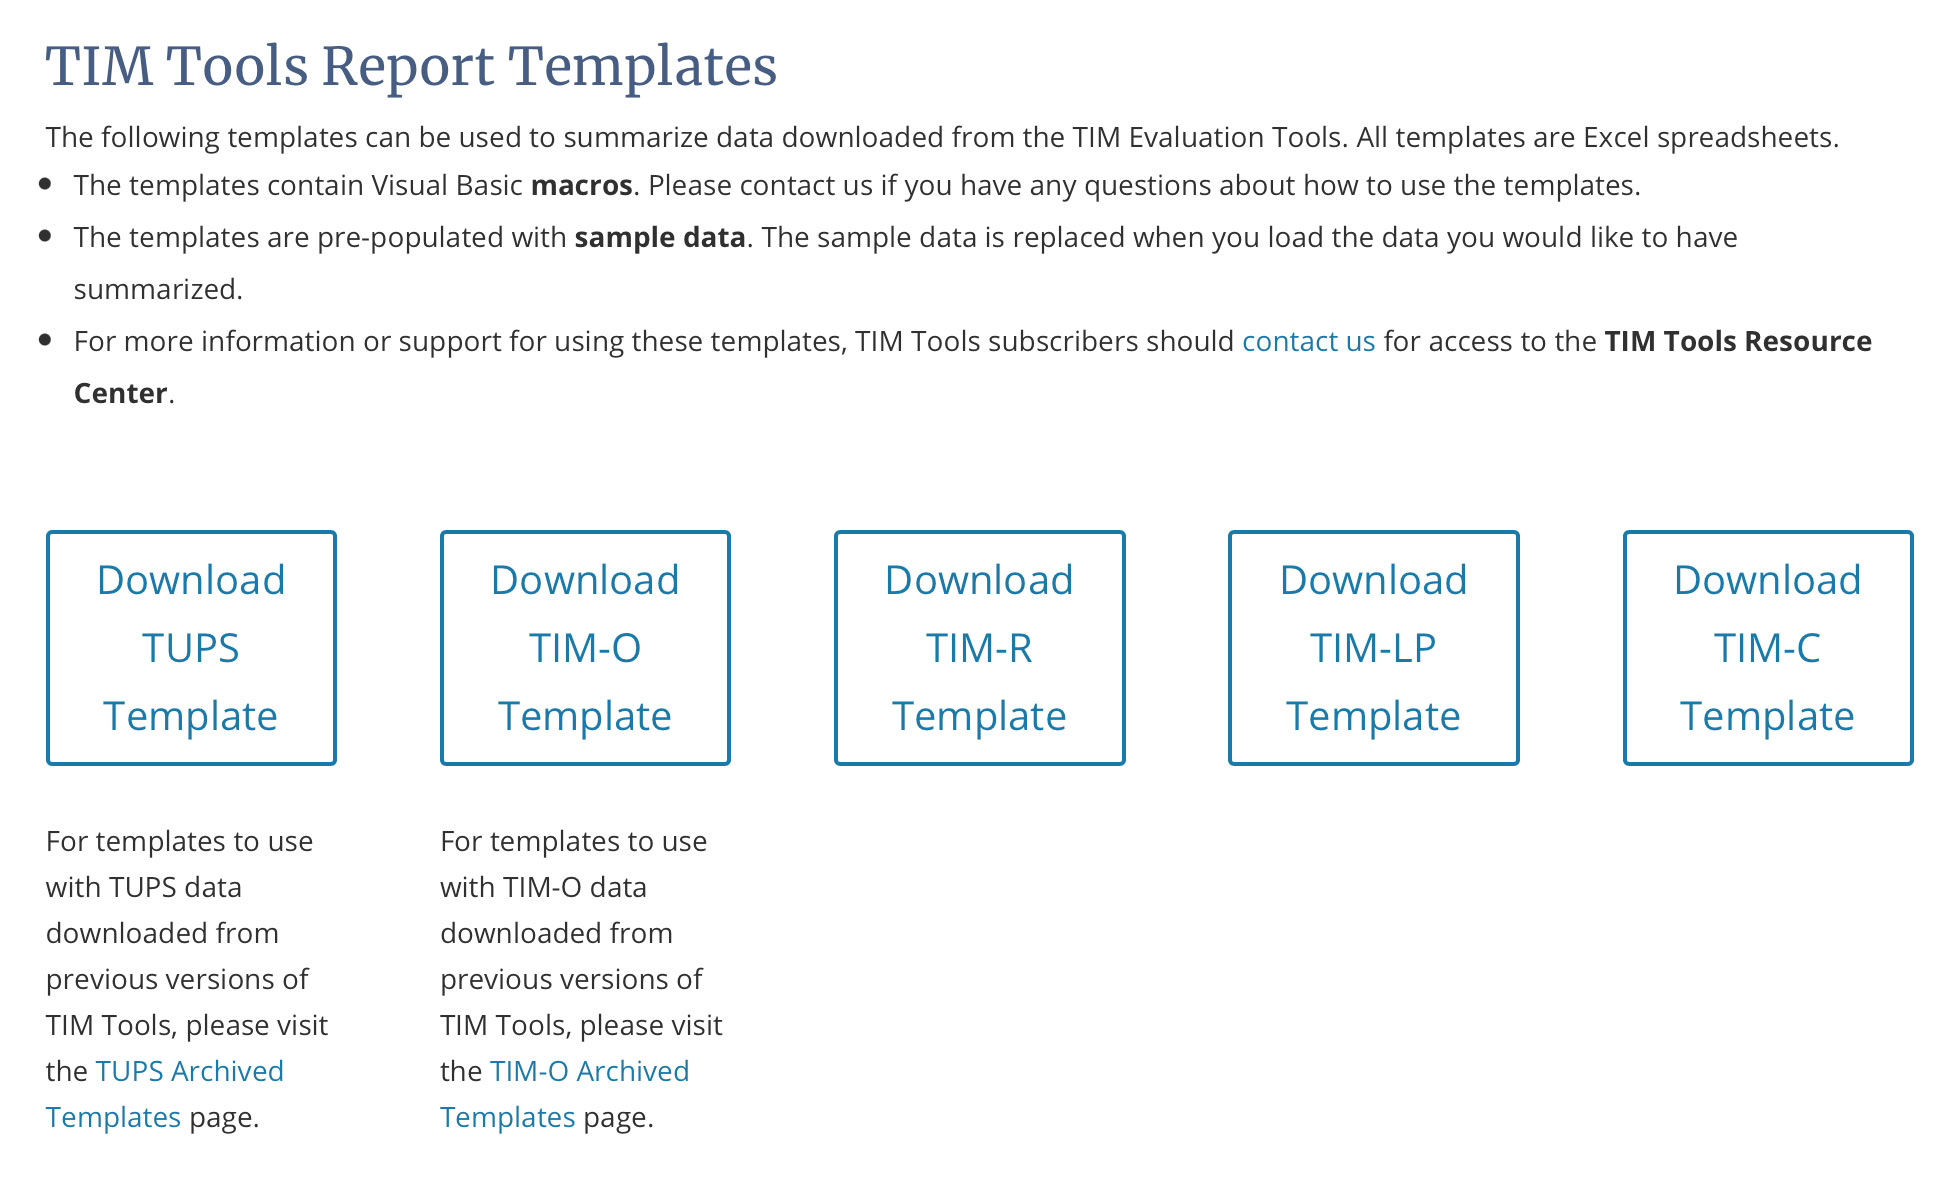
2. Download (and Open) the Related Template
Go to the Report Templates page. Click the button for the type of template you want. Download and open the template. (Click adjacent image to expand.)
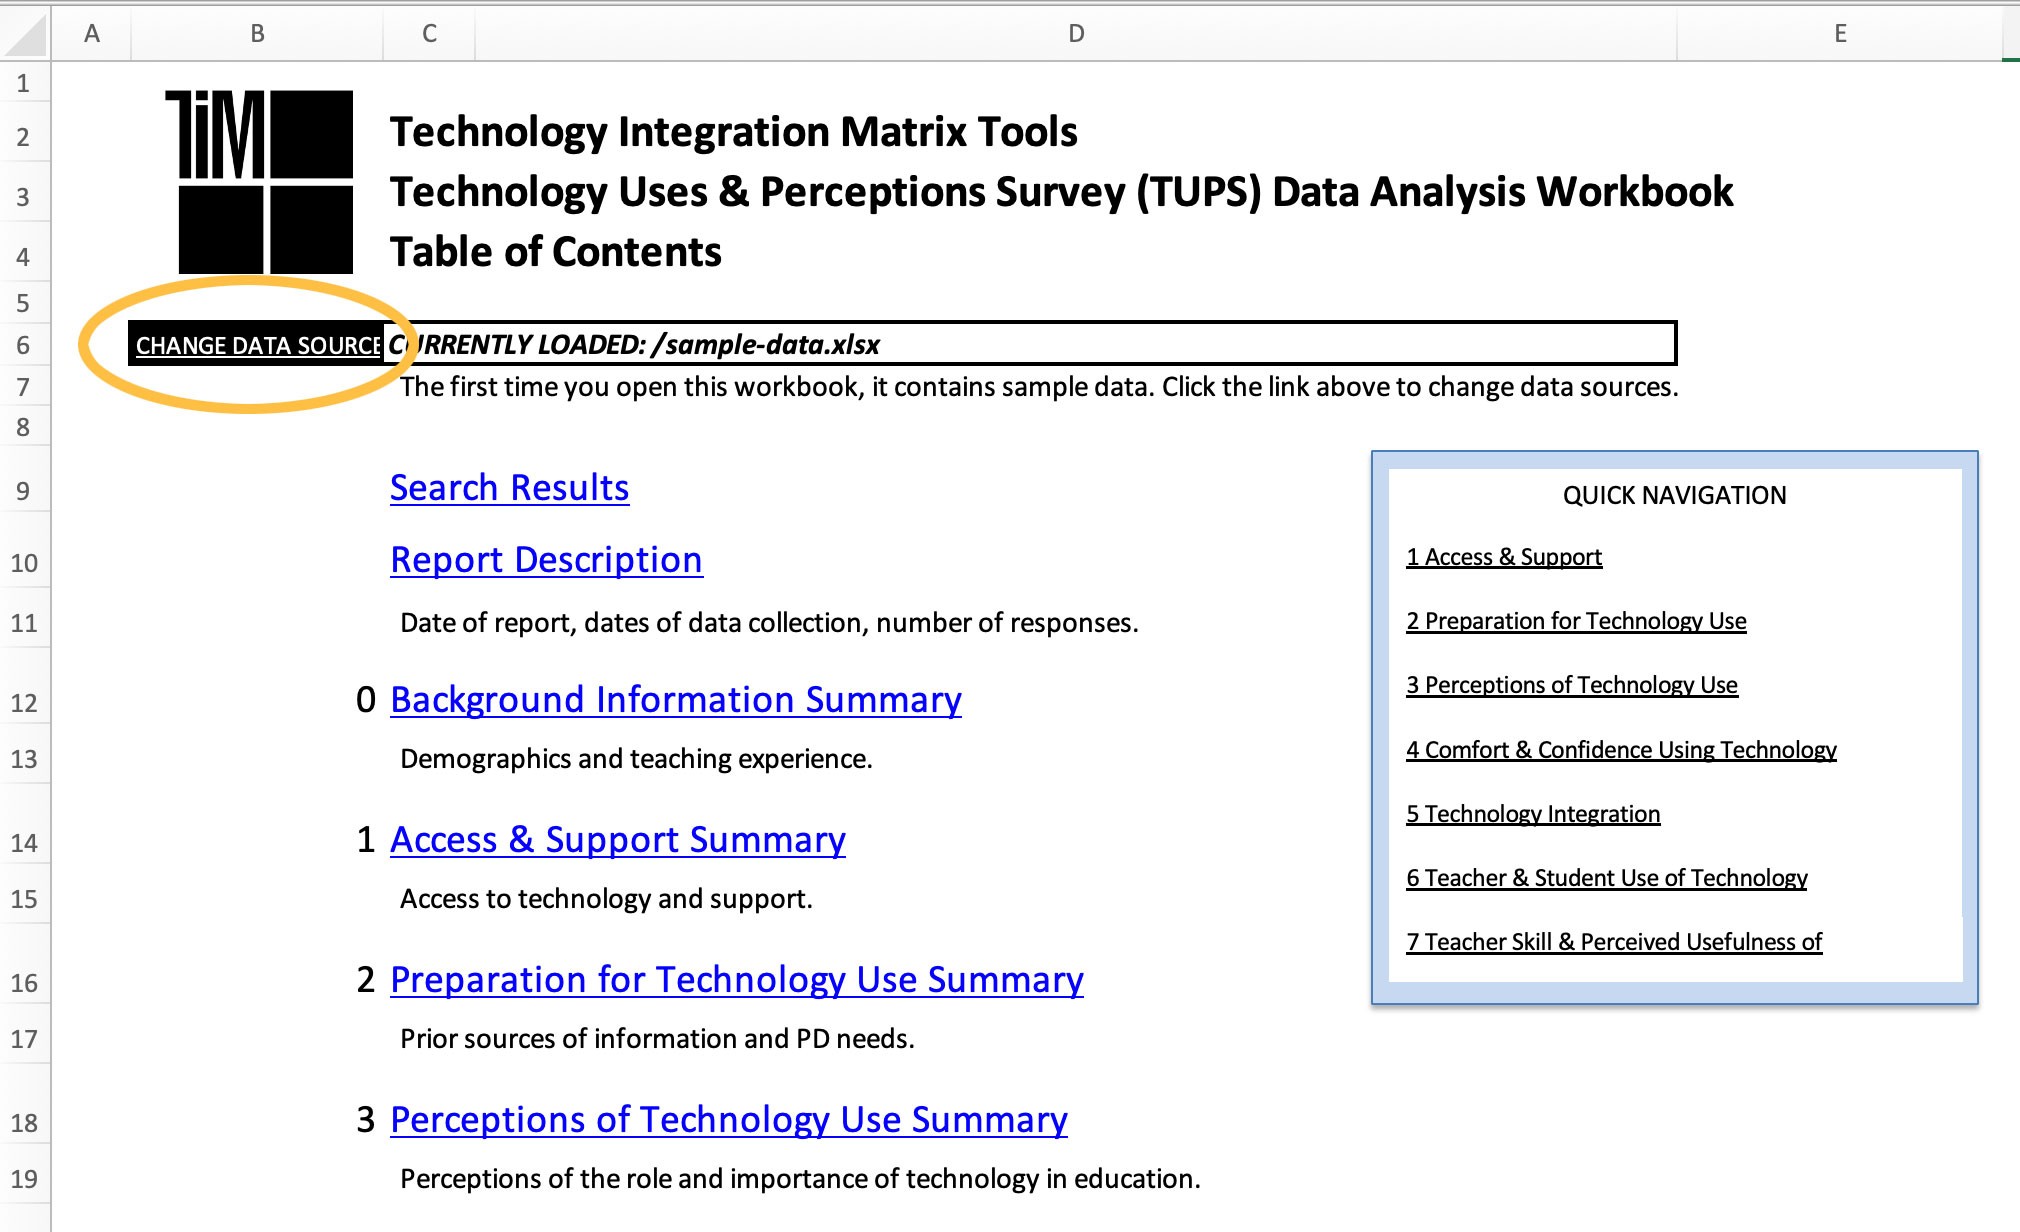
3. Import Your Data into the Template
When you opened the template in step 2, you probably noticed that it was already populated with some sample data for illustrative purposes. To switch to your own data, click the “CHANGE DATA SOURCE” button. This will take you to a sheet from which you can select the file you downloaded and saved in step 1. Your raw data will be imported into the template, replacing the sample data. If you are importing many thousands of records, this may take a moment to process. When it’s finished, the template will now display your own data. (Click adjacent image to expand.)
Using the TUPS Analysis Template
The Technology Uses and Perceptions Survey template is the most robust of the five since the survey includes approximately 200 data points. This template is worth taking some time to carefully work through. There’s much more here than we can cover in a single post, however one of the most important things to remember as you are working through the template is that it’s not just numbers. You can click on specific numbers in the various charts and reveal a list of the teachers behind those numbers thereby making it extremely easy to identify, for example, those who would benefit from specific professional development or those who may make good coachers or trainers themselves for specific topics. The collaged image below gives a feel for what to expect within the TUPS analysis template.
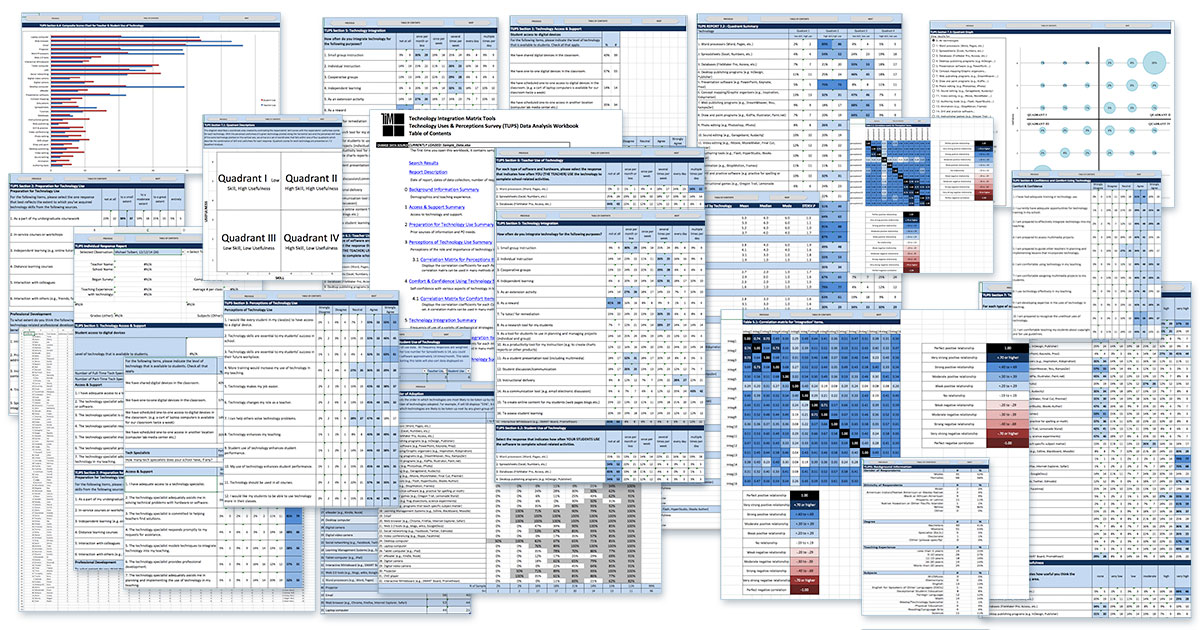
And here is a copy of the table of contents for the TUPS template.
TUPS Data Analysis Template: Table of Contents
Report Description
Date of report, dates of data collection, number of responses.
Background Information Summary
Demographics and teaching experience.
- Access & Support Summary
Access to technology and support. - Preparation for Technology Use Summary
Prior sources of information and PD needs. - Perceptions of Technology Use Summary
Perceptions of the role and importance of technology in education.- 3.1 Correlation Matrix for Perceptions Items
Displays the correlation coefficients for each Perceptions item based on your data set. A correlation matrix can be used in many methods of further multivariate analysis.
- 3.1 Correlation Matrix for Perceptions Items
- Comfort & Confidence Using Technology Summary
Self-confidence with various aspects of technology in teaching and learning.- 4.1 Correlation Matrix for Comfort Items
Displays the correlation coefficients for each Comfort & Confidence item based on your data set.
- 4.1 Correlation Matrix for Comfort Items
- Technology Integration Summary
Frequency of use of a variety of pedagogical strategies and/or grouping techniques.- 5.1 Correlation Matrix for Integration Items
Displays the correlation coefficients for each Integration item based on your data set.
- 5.1 Correlation Matrix for Integration Items
- Teacher & Student Uses of Technology Summary
Frequency of use of specific technologies.- 6.1 Order of Adoption Table
Order in which technologies are most likely to be taken up by respondents. - 6.2 Usefulness, Skill, & Use Data Aggregated by Technology
Measures of central tendency (mean, median, mode) and dispersion (standard deviation). - 6.3 Composite Scores for Teacher & Student Use of Technology
Simplified frequency scores for each technology studied. - 6.4 Composite Scores for Teacher & Student Use Bar Chart
Visual display of data from 6.4.
- 6.1 Order of Adoption Table
- Teacher Skills & Perceived Usefulness of Technology Summary
Separate frequency tables for each component.- 7.1 Quadrant Descriptions
Diagram for interpretation of data reported in 7.2. - 7.2 Quadrant Analysis Summary
Composite Skill-Usefulness analysis.
Quadrant Search Results Page
Displays results of searches that originate on 7.2 Quadrant Analysis Summary. - 7.3 Quadrant Data Chart
Interactive Chart of Composite Skill-Usefulness data.
- 7.1 Quadrant Descriptions
- Individual Report Generator
Using the TIM-O, TIM-R, and TIM-LP Templates
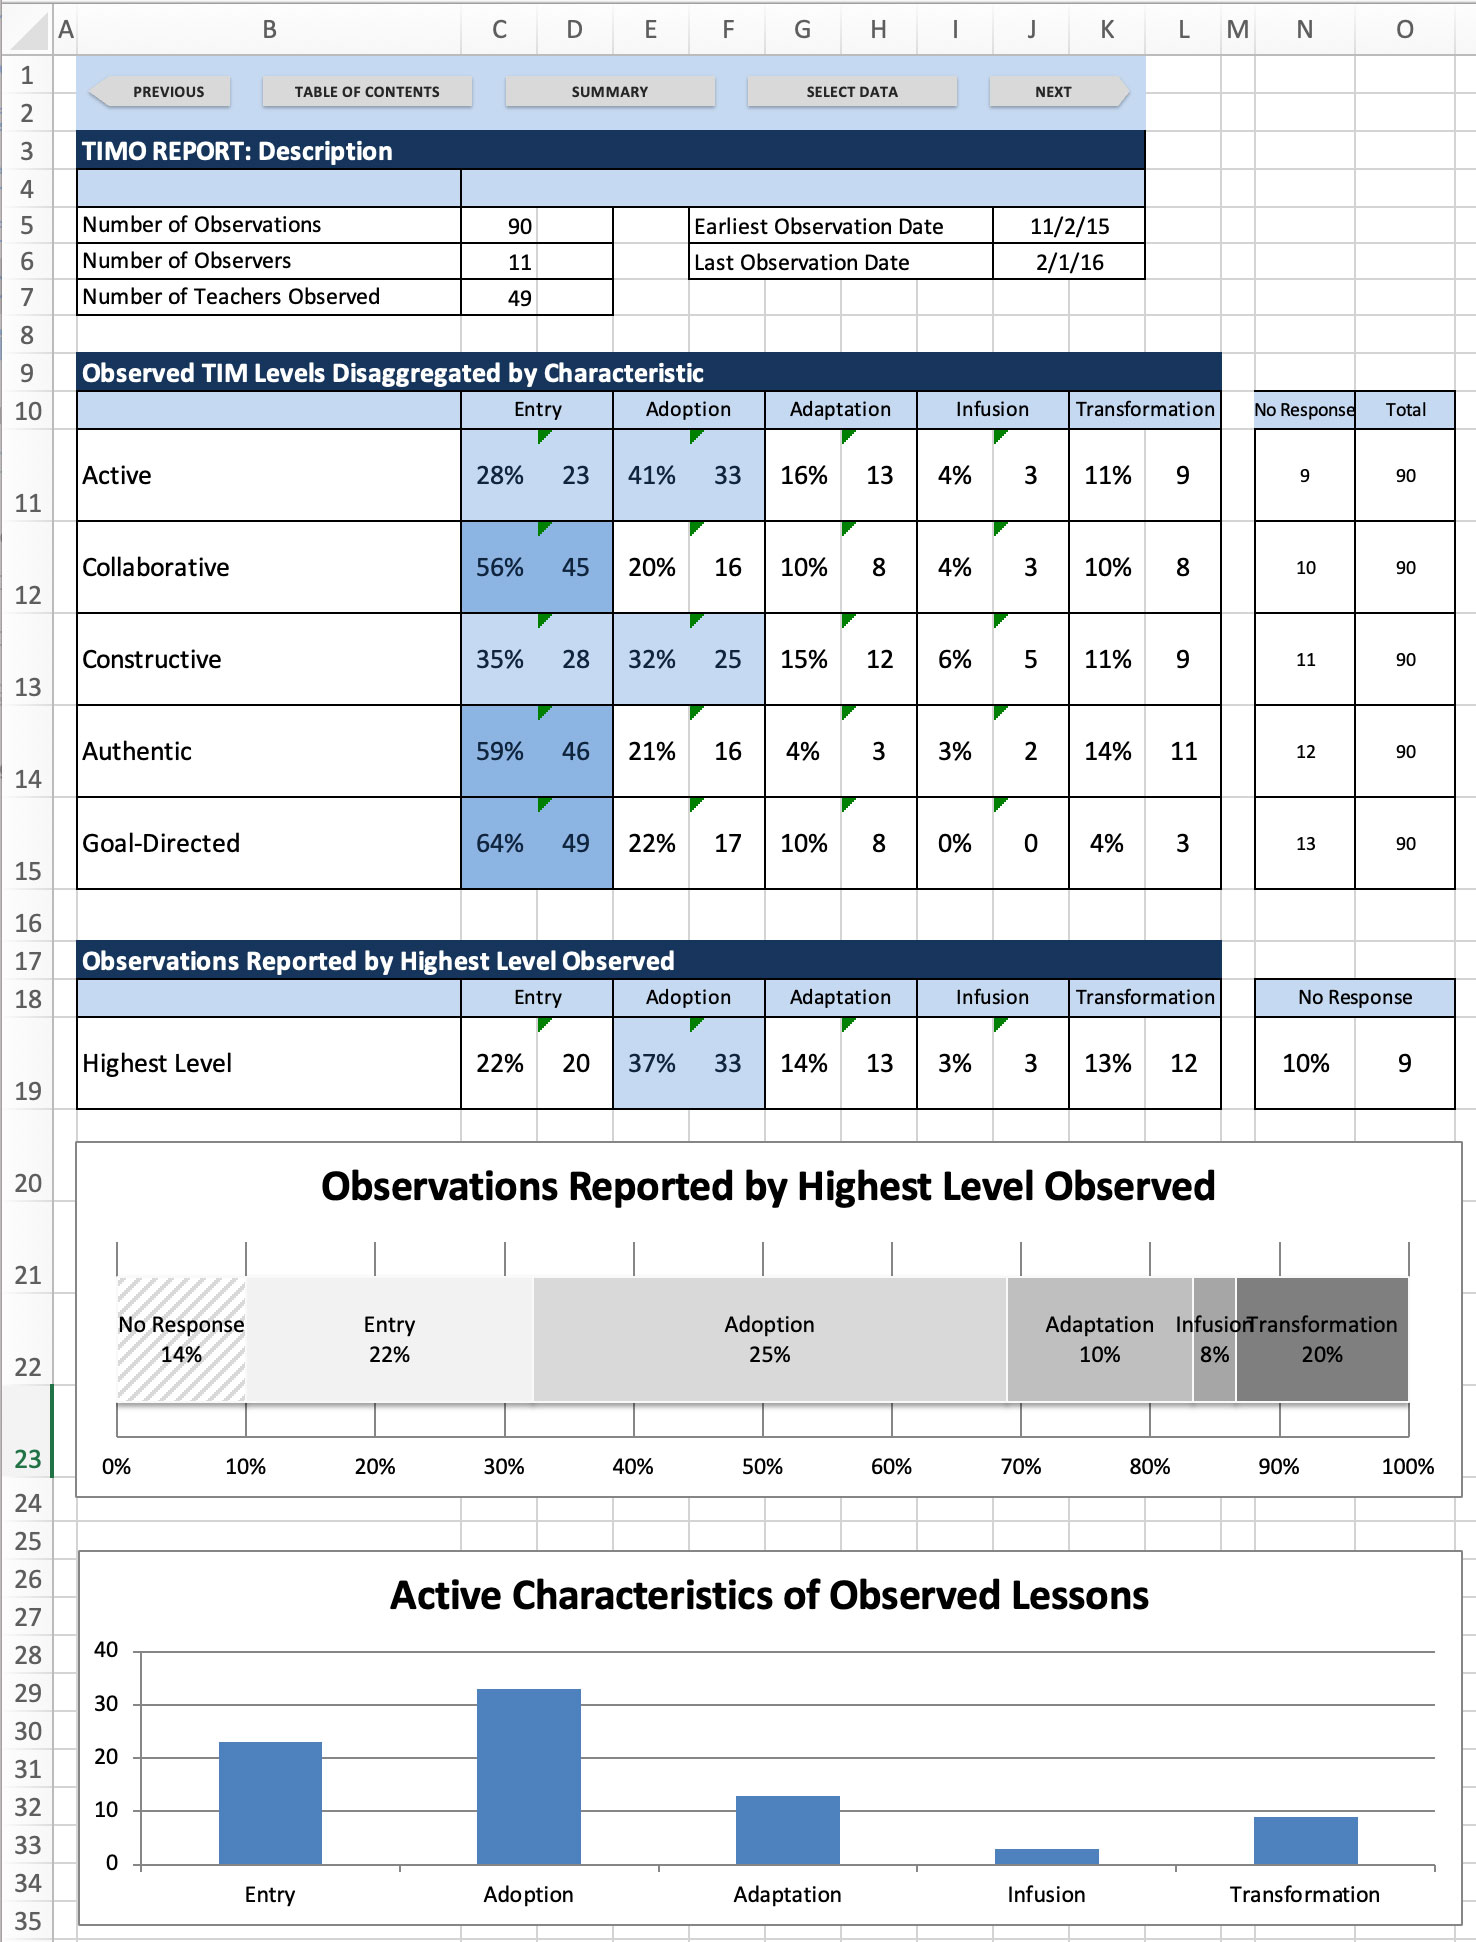
The templates for the TIM-O (Observation Tool), the TIM-R (Teacher Reflection Tool), and the TIM-LP (Lesson Plan Review Tool) are all quite similar. Once you have loaded your data into the template you’ll have access to a summary of observation characteristics and a sheet for each of the five characteristics on the Technology Integration Matrix.
(Click adjacent image to enlarge part of the summary sheet from the TIM-O template.)
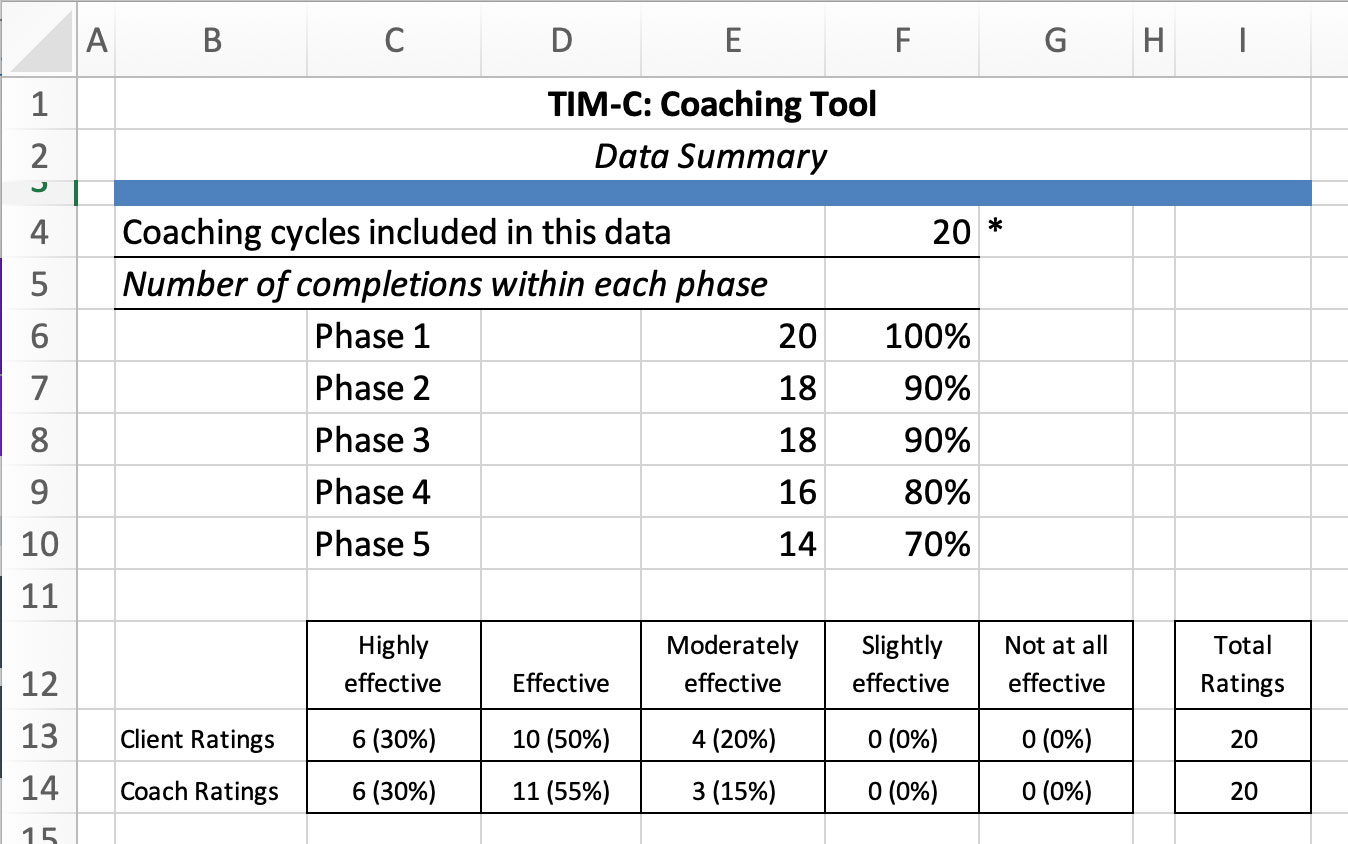
Using the TIM-C Template
The Coaching Tool is the newest addition to the TIM Tools suite, so the current TIM-C template is not yet quite as robust as the others. You will need to manually paste your TIM-C data from the download into sheet 2 of the template. Once you’ve added your data, the dashboard sheet will give you the number of completions for each of the five phases of a coaching cycle and the summary of client and coach ratings of the cycle effectiveness. Additional sheets allow you to review the goals, activities, and check-ins of the cycles included in the report.
(Click adjacent image to enlarge the dashboard sheet from the TIM-C template.)
Related Posts
- Nail Your Next Tech PD with the Quadrant Graph
- Using the TUPS to Target Professional Development
- A Framework for Growth: A Story of TIM Implementation in Graphs
- Using TUPS Data: Individual Items
- Working with TUPS Data: The First Read-Through
- Extensity: A Teacher’s Highest Integration Level
- Highest Levels Observed: The High Watermark for an Observation
- Flexibility: A Teacher’s Range of Technology Integration Levels
- Level Prevalence: A Snapshot of Typical Teacher Classroom Technology Use
- Characteristic Dominance: A Key to Targeting Professional Development
- TIM-Powered Research and Evaluation
- TIM Tools for Dissertation Research
- TIM Tools Application Programming Interface
Want To Know More?
Schedule a personal walk-through of the TIM Tools for yourself or your staff. See how this flexible set of technology integration tools will meet your school or district's specific needs.
Roy Winkelman is a 40+ year veteran teacher of students from every level kindergarten through graduate school. As the former Director of FCIT, he began the Center's focus on providing students with rich content collections from which to build their understanding. When not glued to his keyboard, Dr. Winkelman can usually be found puttering around his tomato garden in Pittsburgh.