Menu
1. TIM Tools Admin Center
The Admin Center provides for management of the TIM Tools suite of applications.
Overview
Getting Started
- Admin Center Access
- Admin Center Dashboard
- Managing Zones (for Districts)
- Managing Zones (for Regional Service Agencies)
- Managing Zones (for Education Ministries, Consultants, Grantors, and Others)
- Managing Schools
Customization
Managing Members
- Uploading and Updating Members
- Profile Screen
- Changing Passwords
- Defining Roles (for Districts)
- Defining Roles (for School Licensees)
- Defining Roles (for Education Ministries, RSAs, Consultants, Grantors, and Others)
Working with Data
- Participation Overview
- Downloading ARTI Data
- Downloading TIM-LP Data
- Downloading TIM-C Data
- Downloading TIM-O Data
- Downloading TIM-R Data
- Downloading TUPS Data
- Using TUPS, TIM-O, TIM-R, and TIM-LP Templates
2. TUPS
The Technology Uses and Perceptions Survey provides essential information for planning technology infrastructure and support and identifying the perceptions and PD needs of teachers.
- TUPS Intro
- Collection Frameworks
- TUPS Intro and Closing Text
- Customizing TUPS Sections and Items
- Accessing School or District TUPS Data
- TUPS Report Template
3. TIM-O / TIM-LP / TIM-R
These three tools are for classroom observation, lesson plan review, and teacher reflection.
Overview
Preparation
TIM-O
- TIM-O: Beginning an Observation
- TIM-O: Question-Based Method
- TIM-O: Matrix-Based Method
- TIM-O: Finishing an Observation
- TIM-O: Print or Share an Observation with a Teacher
- TIM-O: Editing Previous Observations
- TIM-O Report Templates
- Accessing School or District TIM-O Data
TIM-R
TIM-LP
4. TIM-C
The TIM-C allows a coach and client to document the goals, activities, progress, and outcomes of a coaching cycle.
5. ARTI
The ARTI tool provides a framework for teachers to design and conduct their own action research projects.
6. Report Tool
The Report Tool allows a school or district to create TIM-LP, TIM-O, TIM-R, or TUPS reports.
- Report Tool Intro
- Building a New Report
- View, Edit, or Delete Reports
- Interpreting TIM-O Report Data
7. Survey Tool
The Survey Tool allows a school or district to create internal or external surveys on new topics as needed.
- Survey Tool Intro
- Creating a New Internal Survey
- Creating a New Public Survey
- Adding Questions to Your Survey
- Customizing a Library Survey
- Viewing Survey Results
Need help?
Have a question?
Email us at TIM@fcit.us anytime. We want to help you get the most out of your TIM Tools account!
TIM Tools 7.5 Administration Guide
Completing a Coaching Cycle
The TIM-C is not a coaching model, nor is it the coaching itself. Rather, the TIM-C provides a mechanism for recording the goals, actions, and outcomes of a coaching or mentoring cycle. All of the fields within the cycle are optional. The school or district will decide which parts of the TIM-C to use. Some districts may want to utilize all of the sections. Other districts may de-emphasize or even entirely skip some sections.
Summary Screen
When the Edit button is clicked for a cycle on the TIM-C Dashboard page, the user is first taken to a Coaching Cycle Summary screen.
The Summary screen lists all of the input to date for the coaching cycle. The first time it opens, the only information it contains will be the coaching cycle title, the current date, and the names of the members acting as coach and client. Users returning to a coaching cycle will see all of their inputs for each of the five sections.
No direct inputs can be made on the Summary screen. Users should click one of the five menu tabs to enter data:
- Phase 1. Set Goals
- Phase 2. Plan Activities
- Phase 3. Monitor Progress
- Phase 4. Record Outcomes
- Phase 5. Reflect on Coaching Cycle
The sixth menu item (Close Tab) returns the user to the coaching cycle Dashboard. Users can open and close a coaching cycle tab as many times as is necessary to complete the cycle. Even after both the coach and the client have clicked the publish buttons on the Dashboard screen, the coaching cycle can be further edited if desired.
The first time users open a coaching cycle, they should start by clicking on Phase 1: Set Goals and then add a Focus for the cycle.
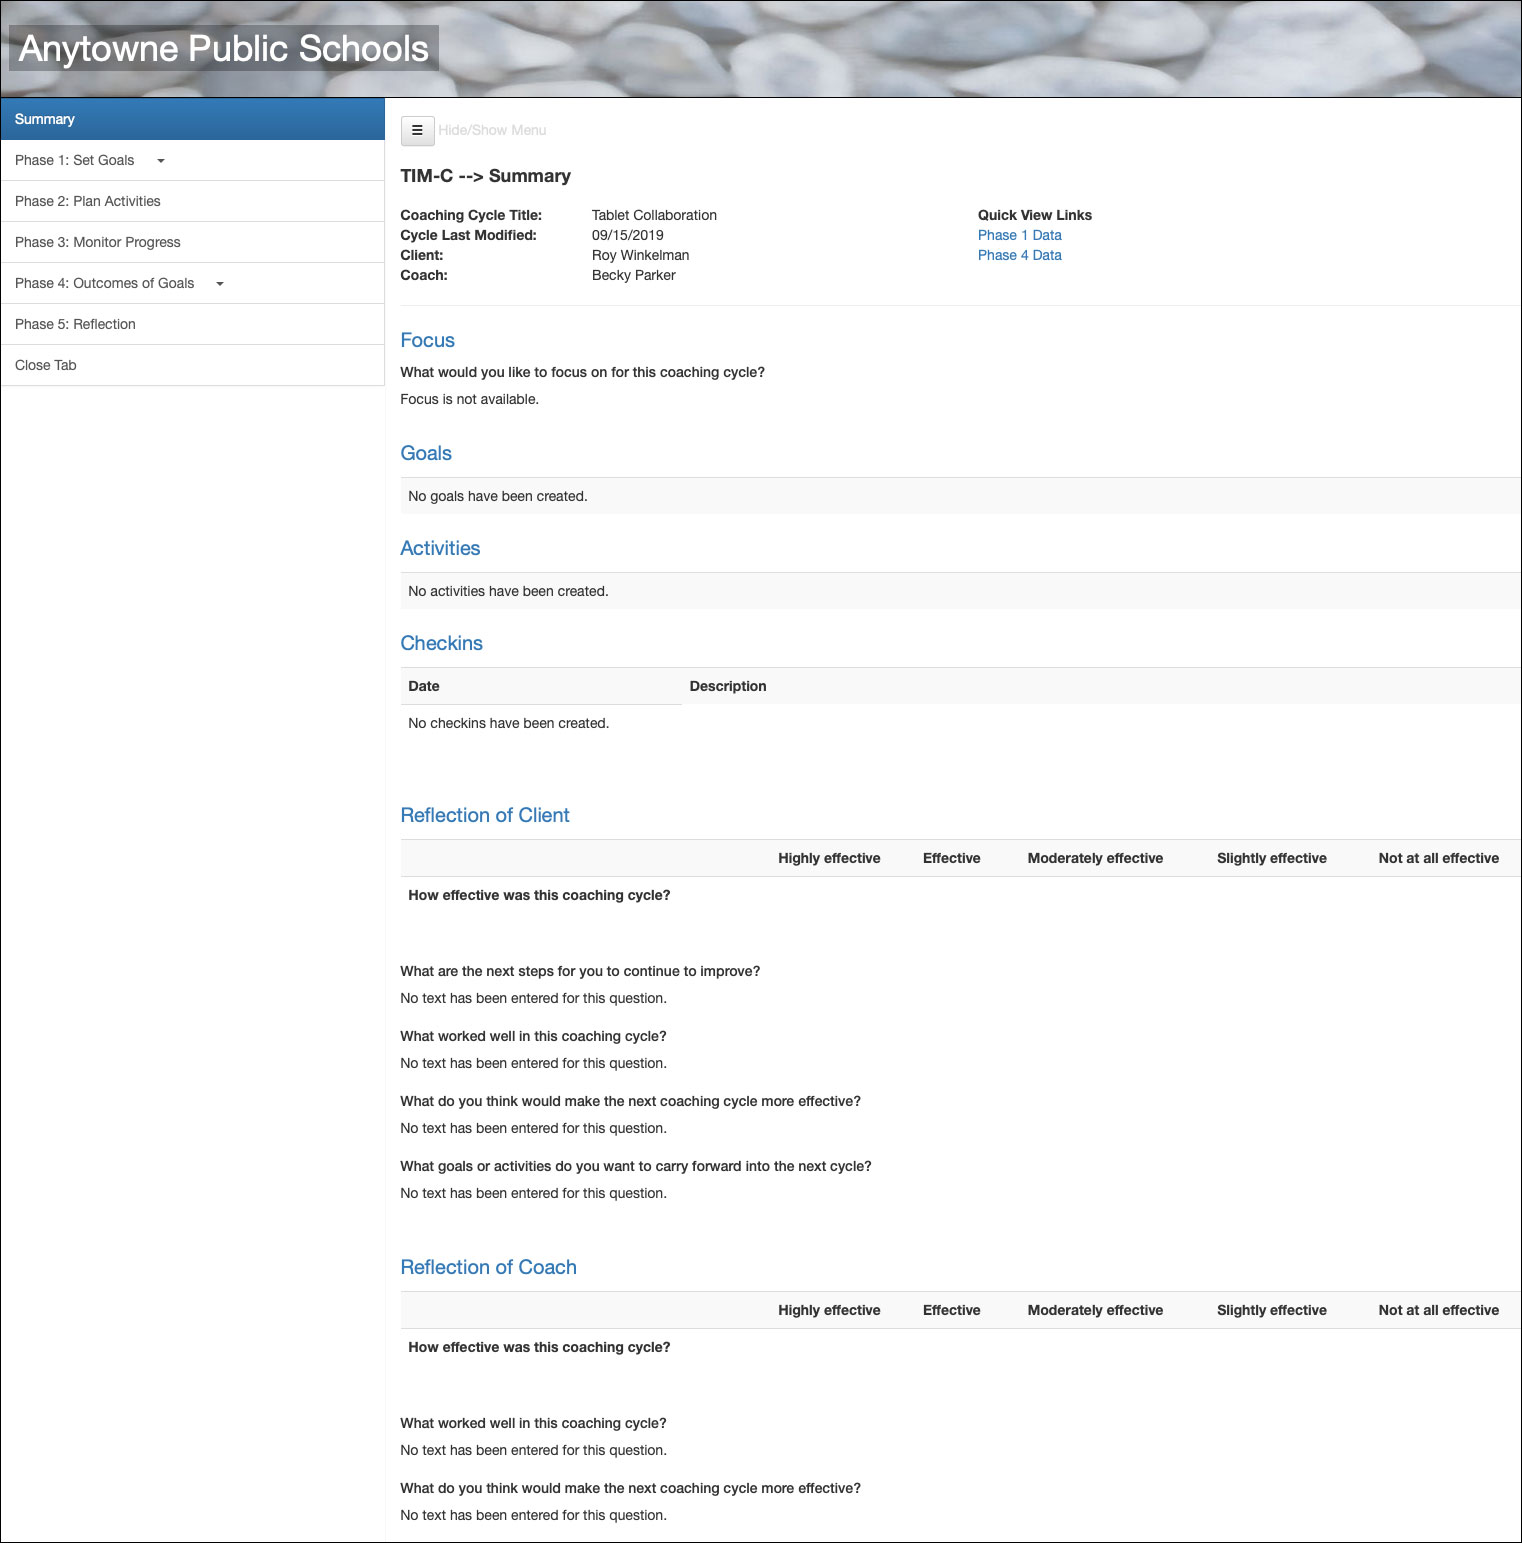
Figure 1. A Summary screen in its initial state before the coach and client have made entries to any of the five phases. NOTE: Clicking any of the small screenshots on this page will open a larger view in lightbox.
Phase 1: Set Goals
Setting Goals is the first step in a coaching cycle. Ideally, this is a personal goal of the client, but it also may be a suggestion of the coach or a top-down recommendation from a school administrator. Regardless of the source, it’s helpful to anchor that goal. TIM Tools provides two ways to do that. Users can choose to anchor their goal with an alignment, with supporting data, or with both.
•Adding Alignments to a TIM Tools Instance
The default installation of TIM Tools includes a “starter kit” of ten alignments related to the Technology Integration Matrix, but any number of additional alignments can be added by a system administrator from within the Admin Center. (See figure 2.) Alignments may include state standards, national or organizational standards, annual themes chosen by administrators, or any other text-based source. Alignments do not have to be related to technology in any way. Once a TIM Tools administrator (super admin, district leader, zone leader, or school leader) adds an additional alignment in the Admin Center it becomes available to all users.
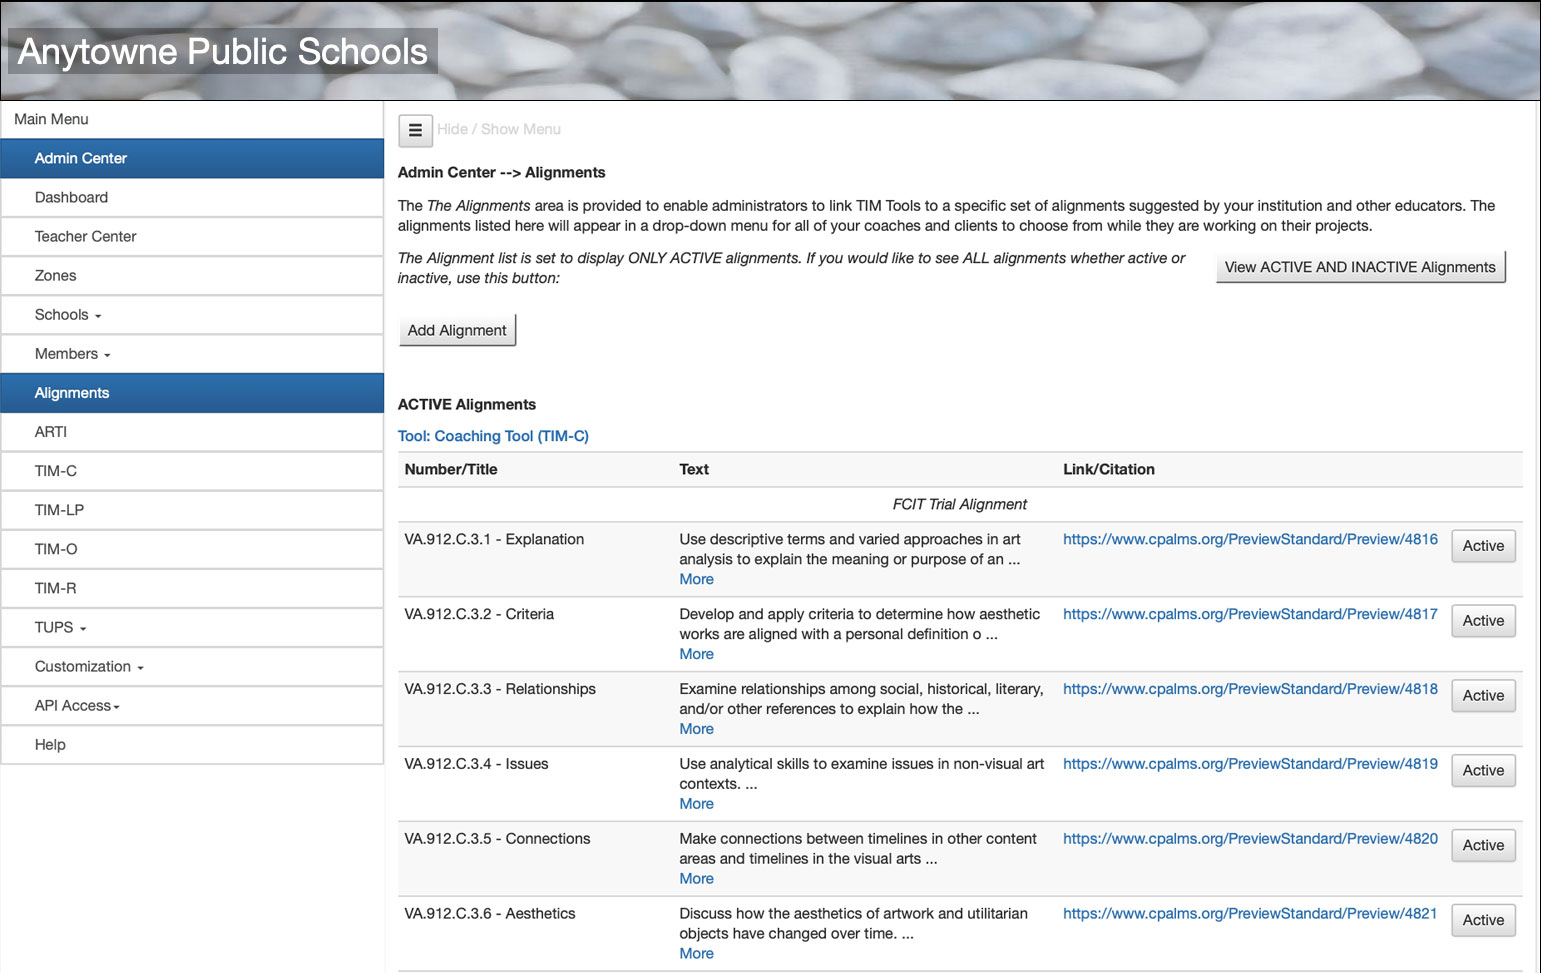
Figure 2. Adding alignments in the TIM Tools Admin Center. In this example, Florida visual arts standards are being entered.
• Selecting Alignments
Users click the “Add an Alignment” button to bring up a screen where they can select from any alignments that have been added to the TIM Tools instance via the Admin Center. Once users select an alignment and click the “Add Alignment” button to confirm, they are returned to the Phase 1: Set Goals screen.
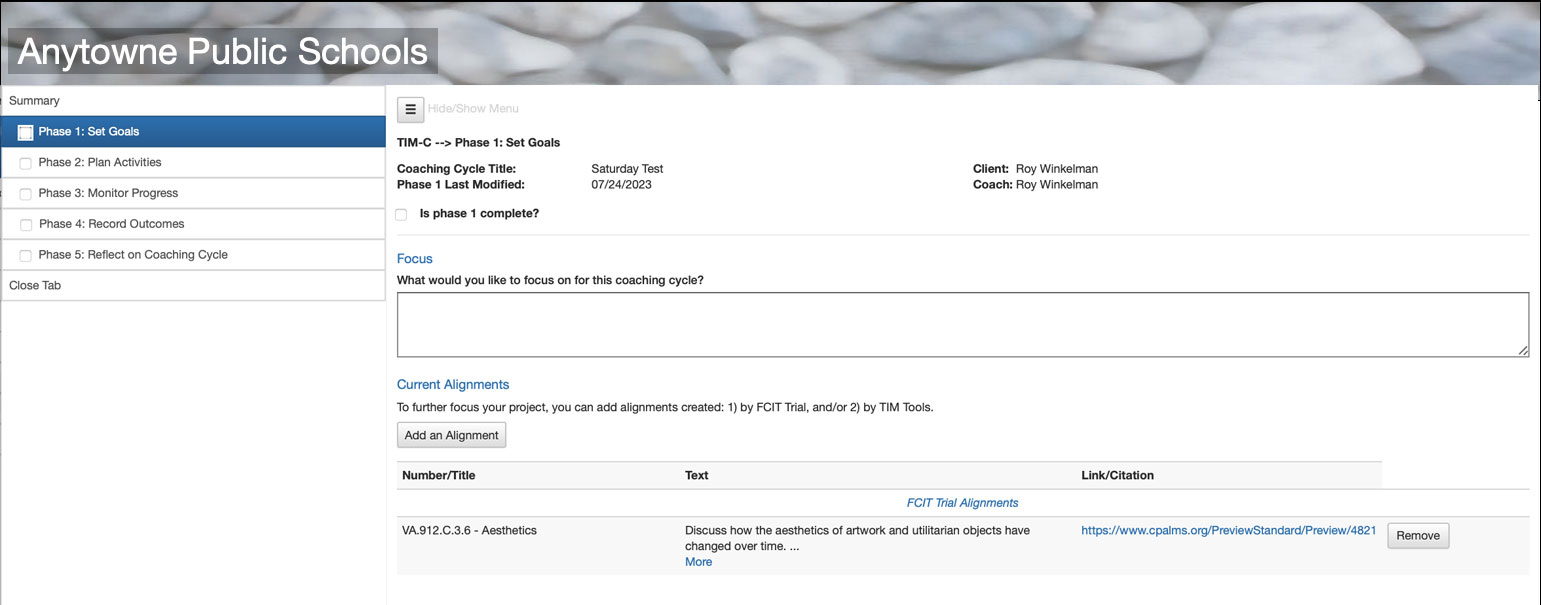
Figure 3. This user has added an Aesthetics standard from the Florida Visual Arts standards.
• Selecting the Supporting Data
Using specific data can help the user to create goals that are more focused, realistic, and measurable. This section allows the identification of starting data for the coaching cycle in three different ways: (1) selecting one or more completed TIM Tools documents, (2) pasting data into the text box, or (3) entering a complete URL for online documents or other resources. More than one type of data may be entered if desired.
By default, only the client may select the supporting data. This keeps access to supporting TIM Tools documents private and emphasizes the fact that a coaching cycle is a collaborative effort around a topic that the client has deemed important. However, the client may choose to allow the coach to view and select the starting data by clicking the checkbox titled Allow coach to select data. Checking this box will give the coach access to the client’s published TIM Tools documents (i.e. completed TUPS, TIM-O, TIM-R, TIM-LP, and TIM-C activities). If the box is left unchecked, the coach will be able to see only the data the client selects.
Just a reminder that all fields within the five phases are optional. Some schools or districts may place a high value on identifying supporting data both here and in the Outcomes phase. Others may consider this optional.
There is an additional field where either the client or the coach may explain why the specific data was chosen for the coaching cycle.

Figure 4. Selecting the supporting data for the goals of a coaching cycle.
• Set Goals
Below the focus text box is displayed a list of the current goals for the coaching cycle. Figure 5 shows a new coaching cycle for which goals have not yet been created. Each time a goal is created, it will appear in the list of Current Goals.
Notice that there as a dropdown menu next to the question, “Is Phase 1 complete?” Some districts give professional development points for each section of a coaching cycle that is completed, so each of the five phases includes this yes/no question. Even if a district is not assigning points for completed sections, users may find it helpful to use these indicators to track which sections they are finished with.
To create a new goal, the user clicks the Create a New Goal button.
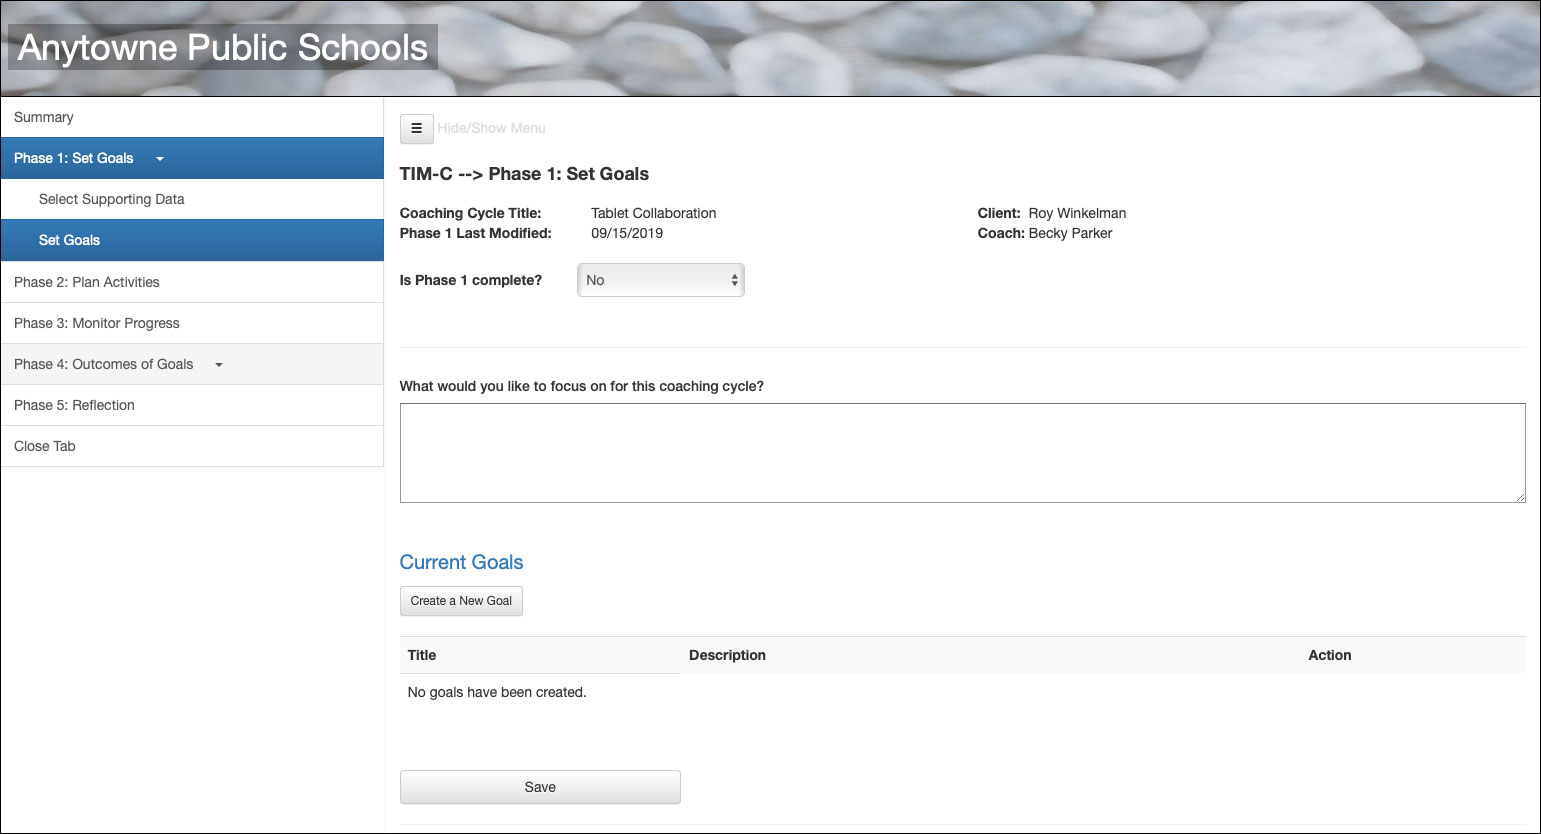
Figure 5. Entering the focus of the cycle and the list of current goals.
• Create a New Goal
A screen similar to figure 4 will open each time the Create a New Goal button is clicked. Here the user enters a title and a short description of the goal. When the text is entered, the user clicks the Save Goal button to return to the previous screen. The new goal will appear in the list of current goals.

Figure 6. Each new goal created includes a title and a short description.
Phase 2: Plan Activities
• List of Current Activities
This screen will list all activities that have been created. For convenience, it also repeats the Focus and Current Goals of the cycle as a reference when creating a new activity.
To create a new activity, the user clicks the Create a New Activity button.

Figure 7. Screen capture of Activities screen for which no activities have been created.
• Create a New Activity
A screen similar to figure 6 will open each time the Create a New Activity button is clicked. Here the user enters a title and a short description of the activity. When the text is entered, the user clicks the Save Activity button to return to the previous screen. The new activity will appear in the list of current activities.
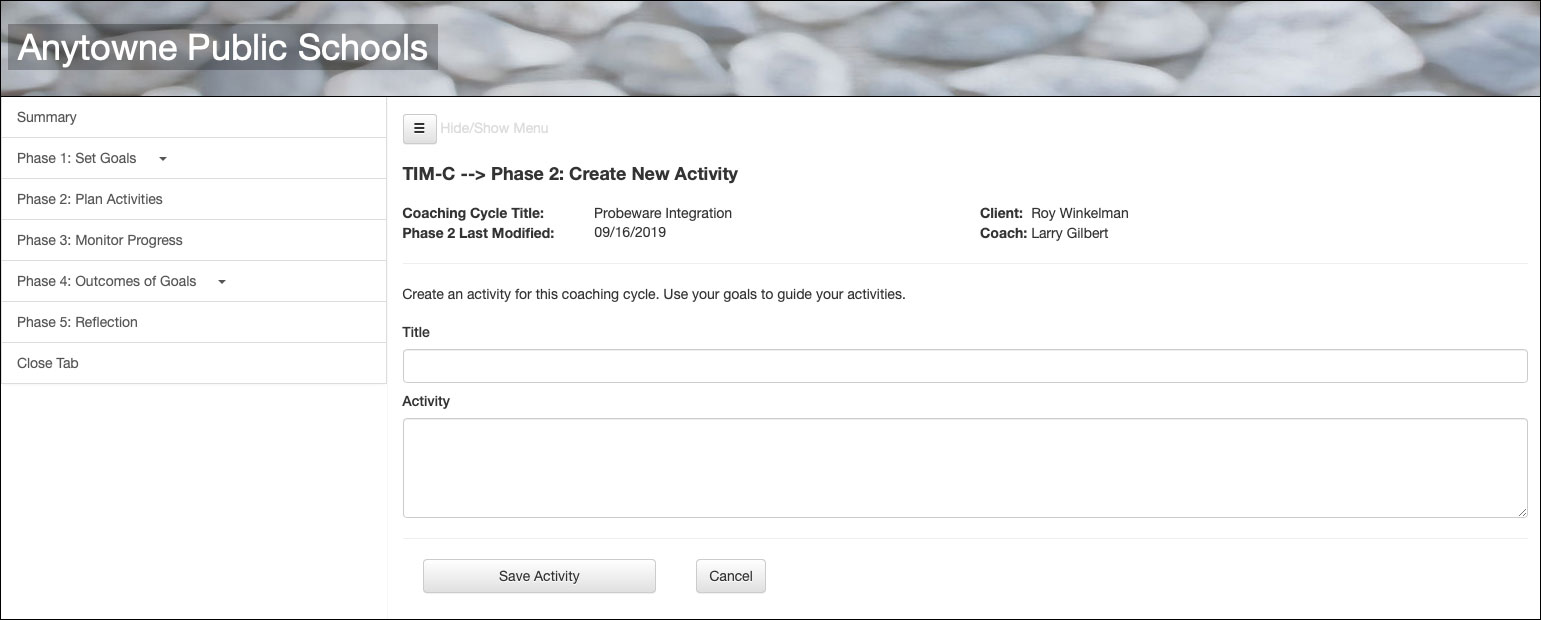
Figure 8. A blank Create New Activity screen.
Phase 3 Monitor Progress
• Monitor Check-ins and Activities
A list of all “check-ins” and activities appears on this screen.
The “check-ins” allow for monitoring progress toward achieving the cycle’s goals. They can be used as a simple means of communication between the client and coach (“Can we meet next Tuesday at 11?”) or as milestones toward a specific activity (“Are the tablets configured to work with the new probes?”) Both the coach and the client can enter text into each check-in.
Click the Create a New Check-in button to open the check-in screen.
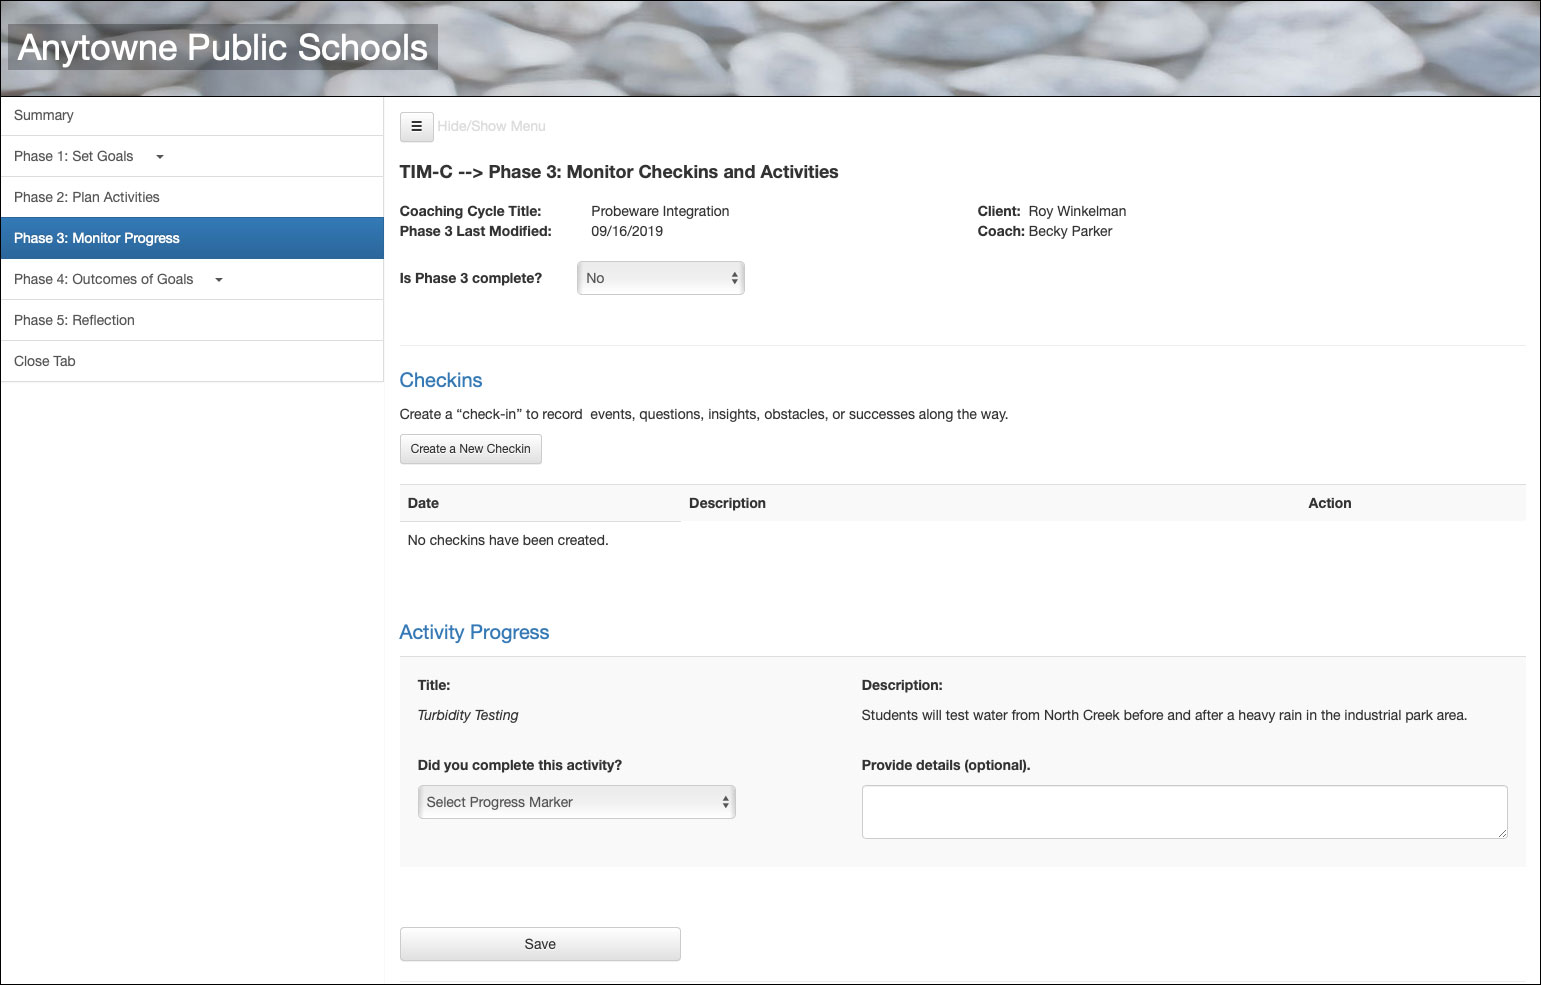
Figure 9. The Check-ins and Activity Progress screen. Only one activity and no check-ins have been created for this cycle.
• New Check-in
Use the New Check-in screen to record events, questions, insights, obstacles, or successes along the way. Both client and coach can add text to the same check-in. Click the Save Check-in button to save and return to the Monitor Check-ins and Activities screen.
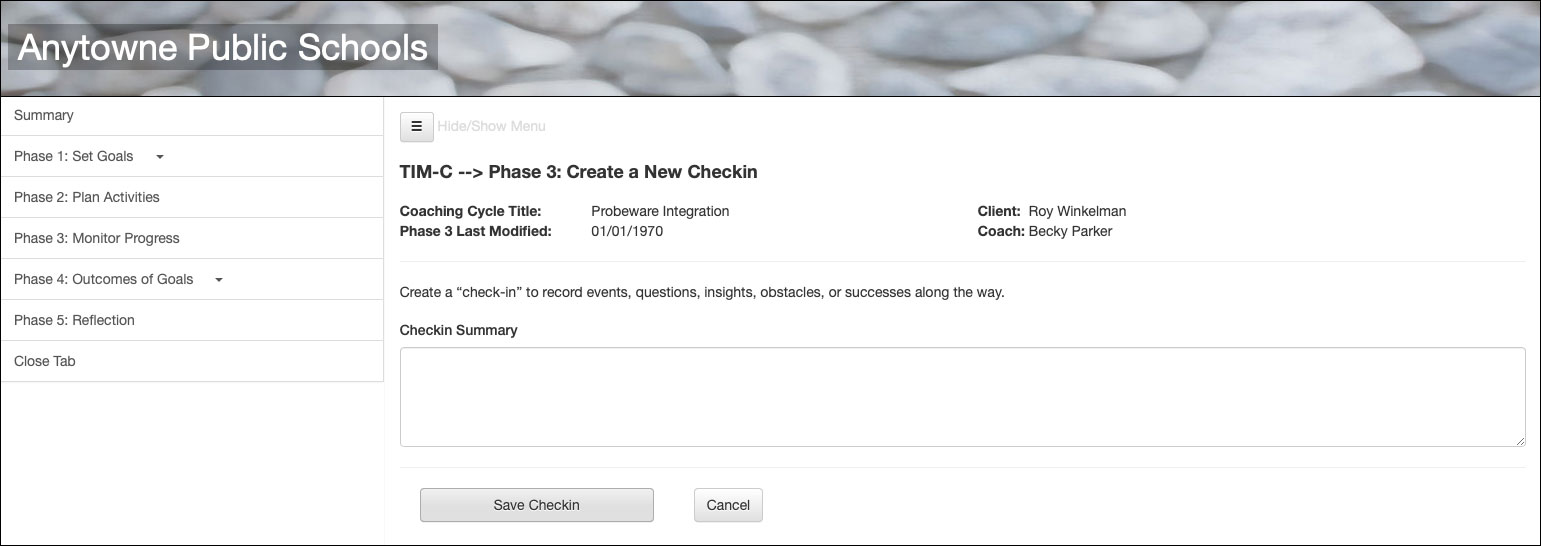
Figure 10. Screen to create a new check-in.
• Activity Progress
For each activity users can set the Progress Marker dropdown menu to Yes, No, or Partially Completed. The adjacent text box can be used to provide additional details if desired.
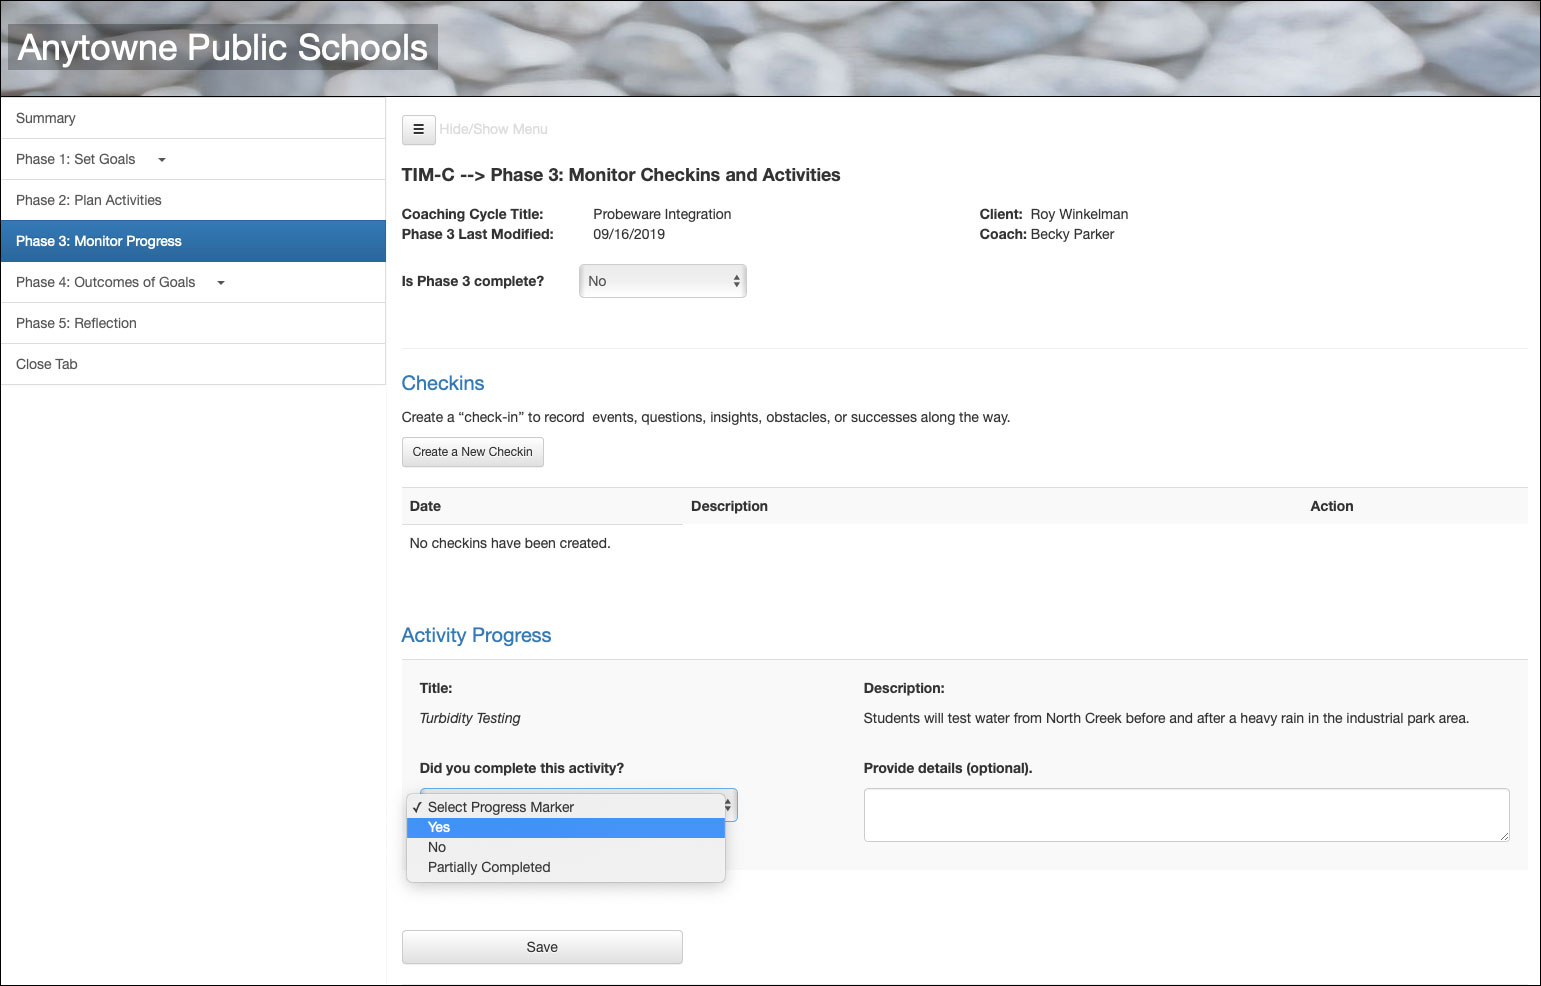
Figure 11. Setting the status of an activity.
Phase 4: Recording Outcomes
• Select Supporting Data
This section allows the identification of outcomes data for the coaching cycle in three different ways: (1) selecting one or more completed TIM Tools documents, (2) pasting data into the text box, or (3) entering a complete URL for online documents or other resources. More than one type of data may be entered if desired.
Just as it was in Phase 1 where data was selected to inform goals, by default, only the client may select the supporting data. This keeps access to supporting TIM Tools documents private. However, the client may choose to allow the coach to view and select the outcomes data by clicking the checkbox titled Allow coach to select data. Checking this box will give the coach access to the client’s published TIM Tools documents (i.e. completed TUPS, TIM-O, TIM-R, TIM-LP, and TIM-C activities). If the box is left unchecked, the coach will be able to see only the data the client selects.
There is an additional field where either the client or the coach may explain how selected data demonstrate, inform, illuminate, or highlight the outcomes of the coaching cycle.
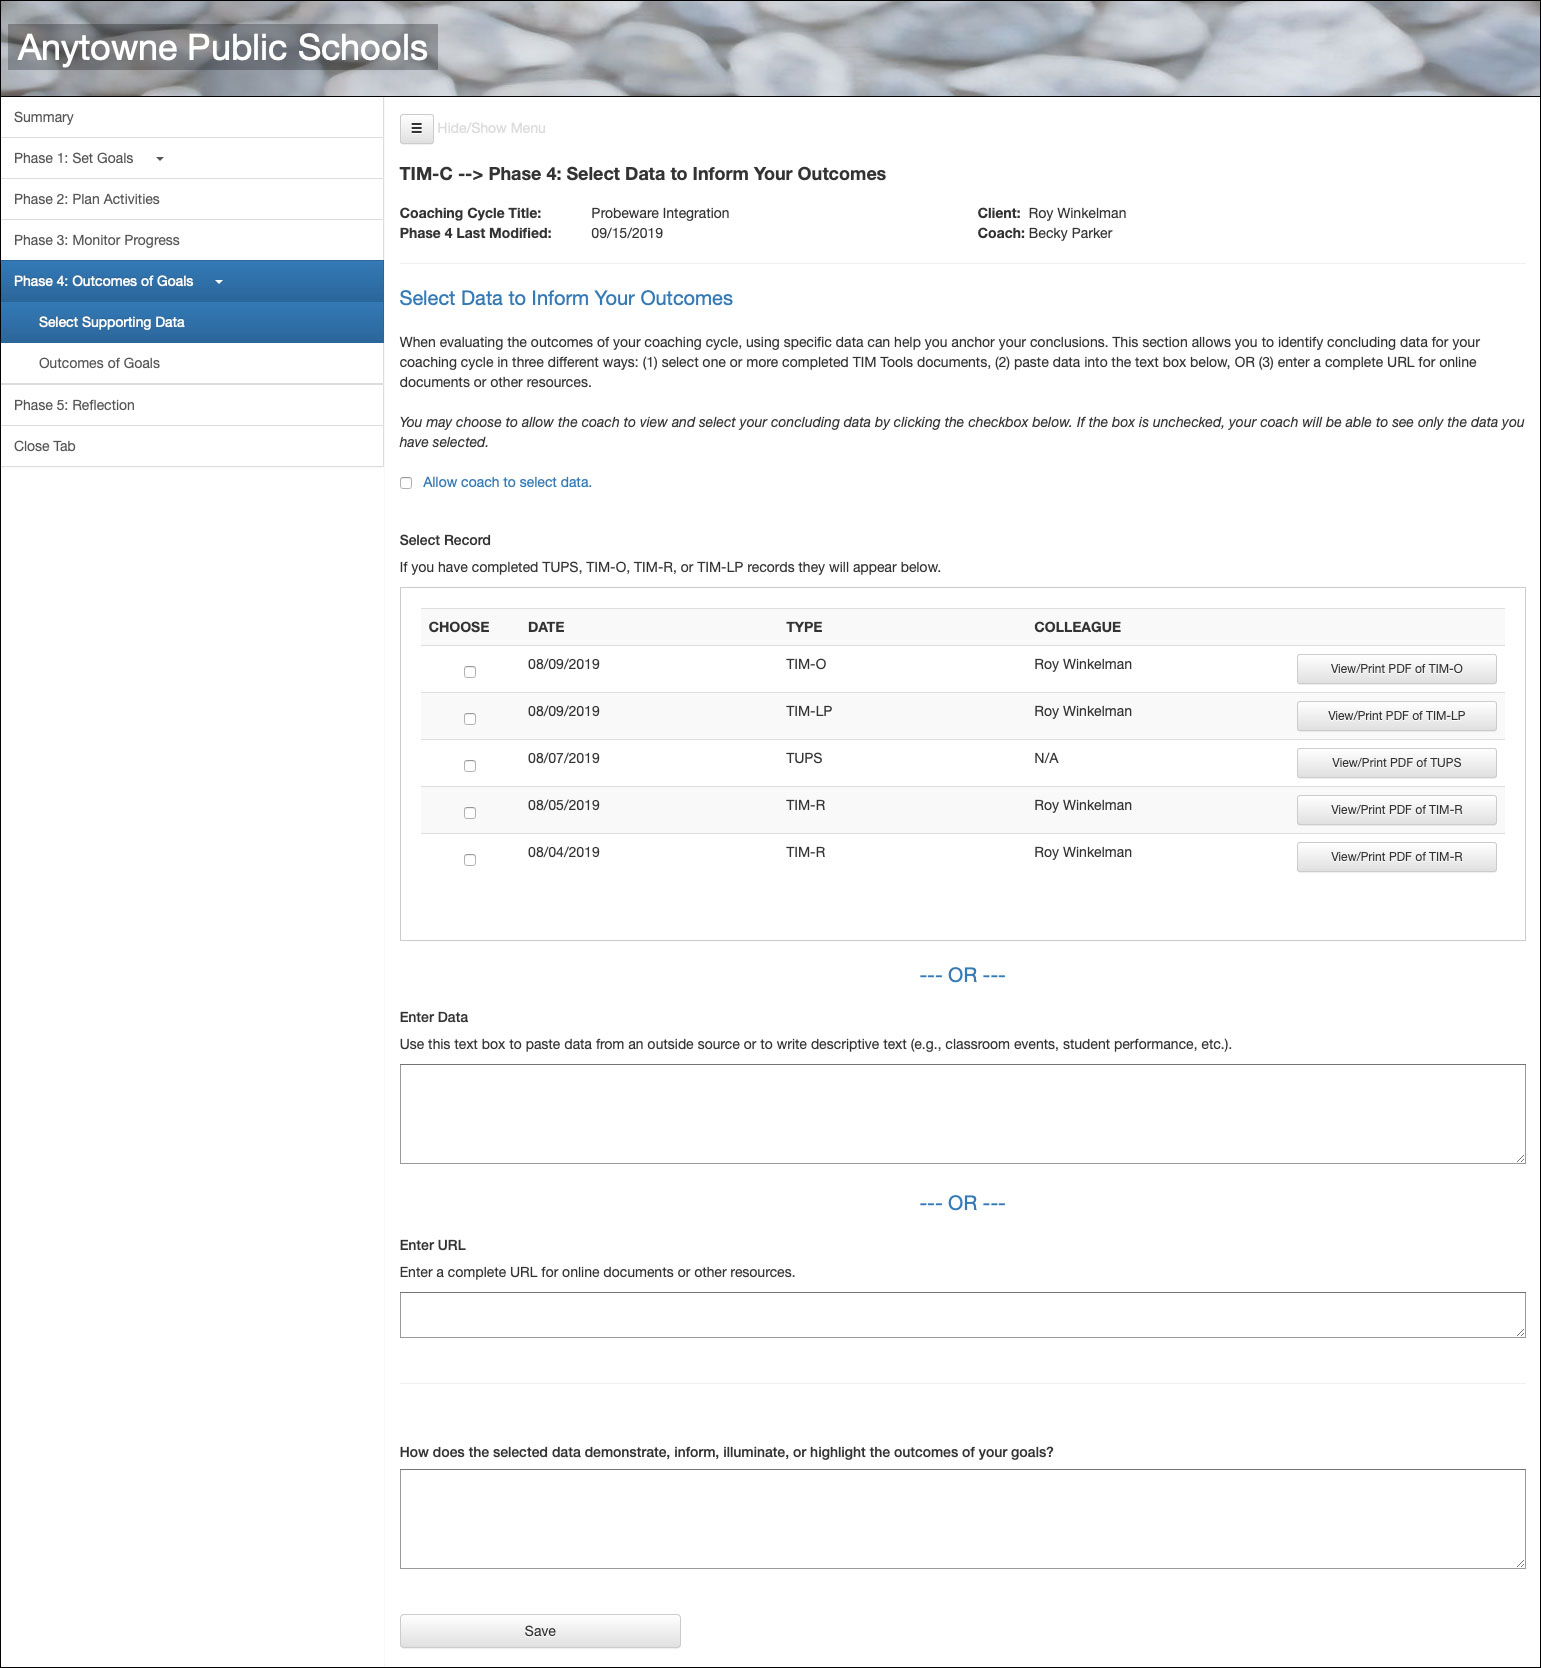
Figure 12. Selecting the supporting data for the outcomes of a coaching cycle.
• Goal Progress
For each goal users can set the Progress Marker dropdown menu to Yes, No, or Partially Completed. The adjacent text box can be used to provide additional details if desired.
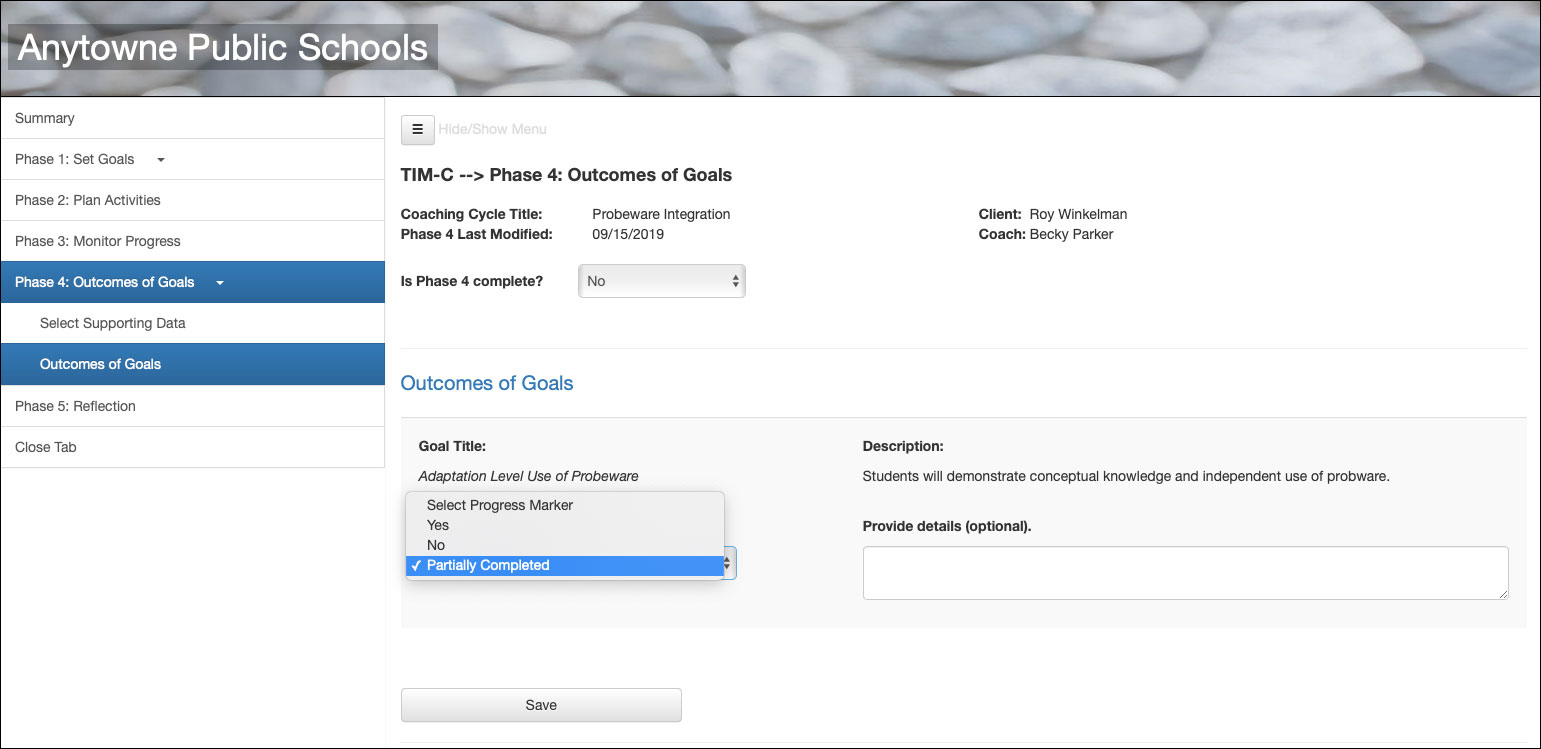
Figure 13. Setting the outcome status of a goal.
Phase 5: Reflection
This is the client’s view of the Reflection Phase. Clients can rate the efficacy of the coaching cycle and enter text to answer four reflective questions. The coach’s view includes the rating scale and two text questions. The client and coach can enter text only into their respective boxes, but each can see the rating and textfields of the other.
When the coaching cycle has been completed, use the Close Tab link to return to the TIM-C Dashboard, where the cycle can be tagged as published by both the client and the coach.
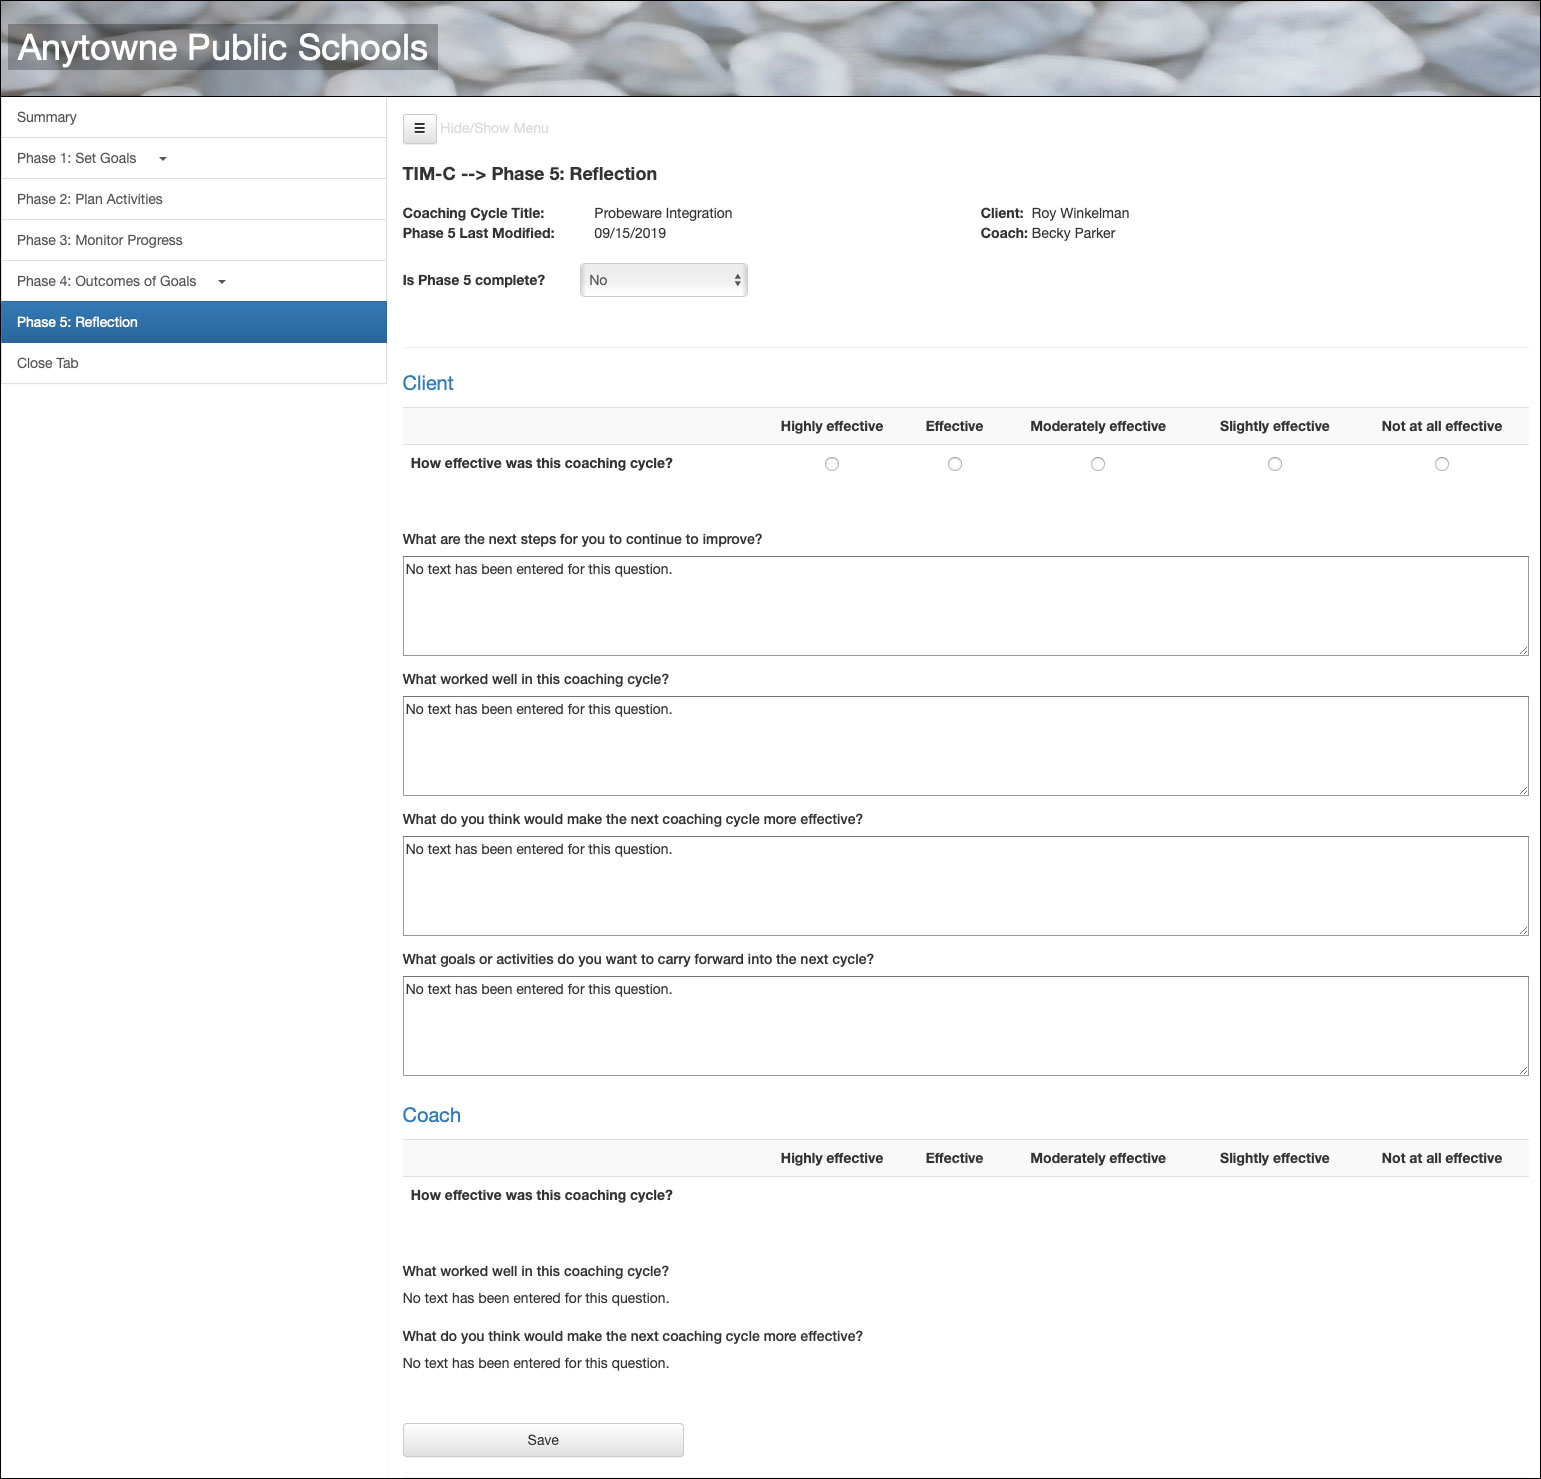
Figure 14. This is the client’s view of the Reflection Phase.