Menu
1. TIM Tools Admin Center
The Admin Center provides for management of the TIM Tools suite of applications.
Overview
Getting Started
- Admin Center Access
- Admin Center Dashboard
- Managing Zones (for Districts)
- Managing Zones (for Regional Service Agencies)
- Managing Zones (for Education Ministries, Consultants, Grantors, and Others)
- Managing Schools
Customization
Managing Members
- Uploading and Updating Members
- Profile Screen
- Changing Passwords
- Defining Roles (for Districts)
- Defining Roles (for School Licensees)
- Defining Roles (for Education Ministries, RSAs, Consultants, Grantors, and Others)
Working with Data
- Participation Overview
- Downloading ARTI Data
- Downloading TIM-LP Data
- Downloading TIM-C Data
- Downloading TIM-O Data
- Downloading TIM-R Data
- Downloading TUPS Data
- Using TUPS, TIM-O, TIM-R, and TIM-LP Templates
2. TUPS
The Technology Uses and Perceptions Survey provides essential information for planning technology infrastructure and support and identifying the perceptions and PD needs of teachers.
- TUPS Intro
- Collection Frameworks
- TUPS Intro and Closing Text
- Customizing TUPS Sections and Items
- Accessing School or District TUPS Data
- TUPS Report Template
3. TIM-O / TIM-LP / TIM-R
These three tools are for classroom observation, lesson plan review, and teacher reflection.
Overview
Preparation
TIM-O
- TIM-O: Beginning an Observation
- TIM-O: Question-Based Method
- TIM-O: Matrix-Based Method
- TIM-O: Finishing an Observation
- TIM-O: Print or Share an Observation with a Teacher
- TIM-O: Editing Previous Observations
- TIM-O Report Templates
- Accessing School or District TIM-O Data
TIM-R
TIM-LP
4. TIM-C
The TIM-C allows a coach and client to document the goals, activities, progress, and outcomes of a coaching cycle.
5. ARTI
The ARTI tool provides a framework for teachers to design and conduct their own action research projects.
6. Report Tool
The Report Tool allows a school or district to create TIM-LP, TIM-O, TIM-R, or TUPS reports.
- Report Tool Intro
- Building a New Report
- View, Edit, or Delete Reports
- Interpreting TIM-O Report Data
7. Survey Tool
The Survey Tool allows a school or district to create internal or external surveys on new topics as needed.
- Survey Tool Intro
- Creating a New Internal Survey
- Creating a New Public Survey
- Adding Questions to Your Survey
- Customizing a Library Survey
- Viewing Survey Results
Need help?
Have a question?
Email us at TIM@fcit.us anytime. We want to help you get the most out of your TIM Tools account!
TIM Tools 7.5 Administration Guide
TUPS Introduction
The Technology Uses and Perceptions Survey provides essential information about the current teacher use and perceptions of technology. The results can be used to collect baseline data for special initiatives, inform technology purchase decisions, identify professional development needs, and facilitate coaching in the use of instructional technology. The TUPS looks at what teachers believe about the role of technology in the classroom, as well as their comfort and confidence with technology in general, with pedagogy of technology, with a variety of different specific technologies, and it also asks about the frequency that they use those technologies and the frequency with which their students use those technologies. The survey includes 200 items in seven categories and provides valuable data to guide school- and district-level decision-making. The survey sections include:
- Technology Access and Support
- Preparation for Technology Use
- Perceptions of Technology Use
- Confidence and Comfort Using Technology
- Technology Integration
- Teacher and Student Use of Technology
- Technology Skills and Usefulness
As part of the TIM Tools suite, the TUPS works from a common online database of user identities and permissions. User records can be added in batches or individually. Survey responses can be downloaded at any time for review. You can turn access to the survey on or off throughout the year and track completion of any user.
The survey data helps to target professional development efforts to meet the needs of teachers in your school or district. The survey helps identify how well prepared teachers are to integrate technology in meaningful ways. It also helps identify the technology professional development topics that teachers want and need.
The TUPS is the perfect tool to use annually, or at the beginning and end of any technology project to measure the changes in how teachers relate to technology in their work. Grant administrators can use pre and post comparisons for grant evaluation reports. It supports teacher inquiry by providing the teacher with a tool for recording changes in classroom usage of technology. The information is also useful for planning technology infrastructure and support and getting a snapshot of the perceptions of teachers.
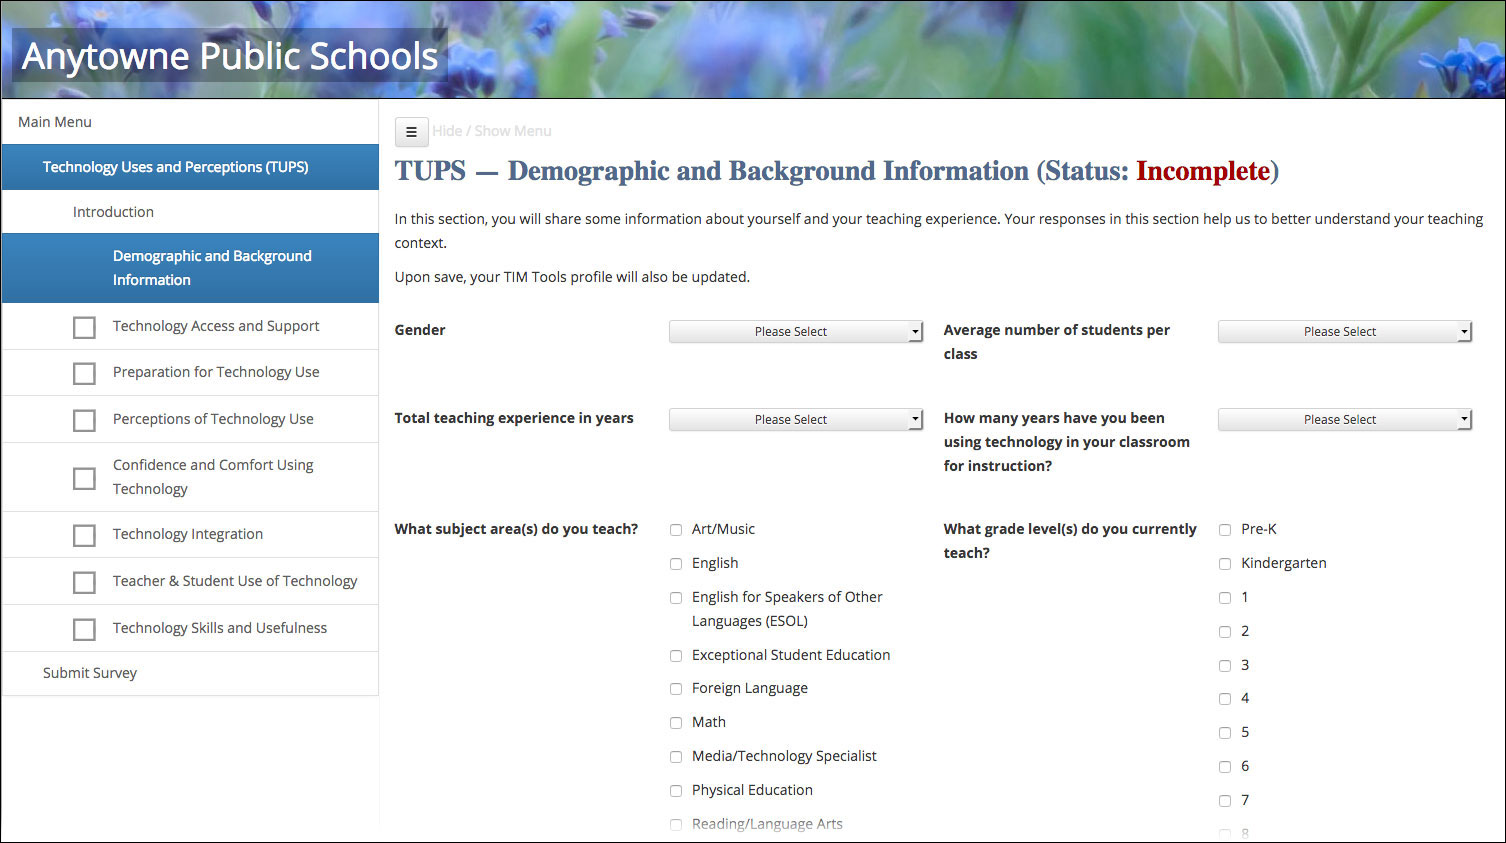
Figure 1. In addition to the seven sections of questions, the TUPS also includes a demographic and background section, which can be turned on or off. If users have already added any demographic information to their personal profile, that information will automatically prepopulate eliminating the need to enter the same information in two places.
Survey participants can log into their TIM Tools account and complete the survey sections in any order. If they log out before completing all sections, when they log back in again, they can pick up where they left off. Checkboxes in the sidebar menu indicate which sections have been completed. Some districts prefer to break the survey into multiple parts, for example they could administer the demographics and first three question sections during one month and then administer the remaining four sections during the following month. The TUPS is designed to provide complete flexibility for the client. In addition to turning sections on or off, individual questions can also be turned on or off. Furthermore, each individual question can be easily customized. For example, the TUPS refers to a district’s “technology specialists” at one point. If your district uses a different term for technology specialist, the question can be revised using the convenient Admin Center interface.
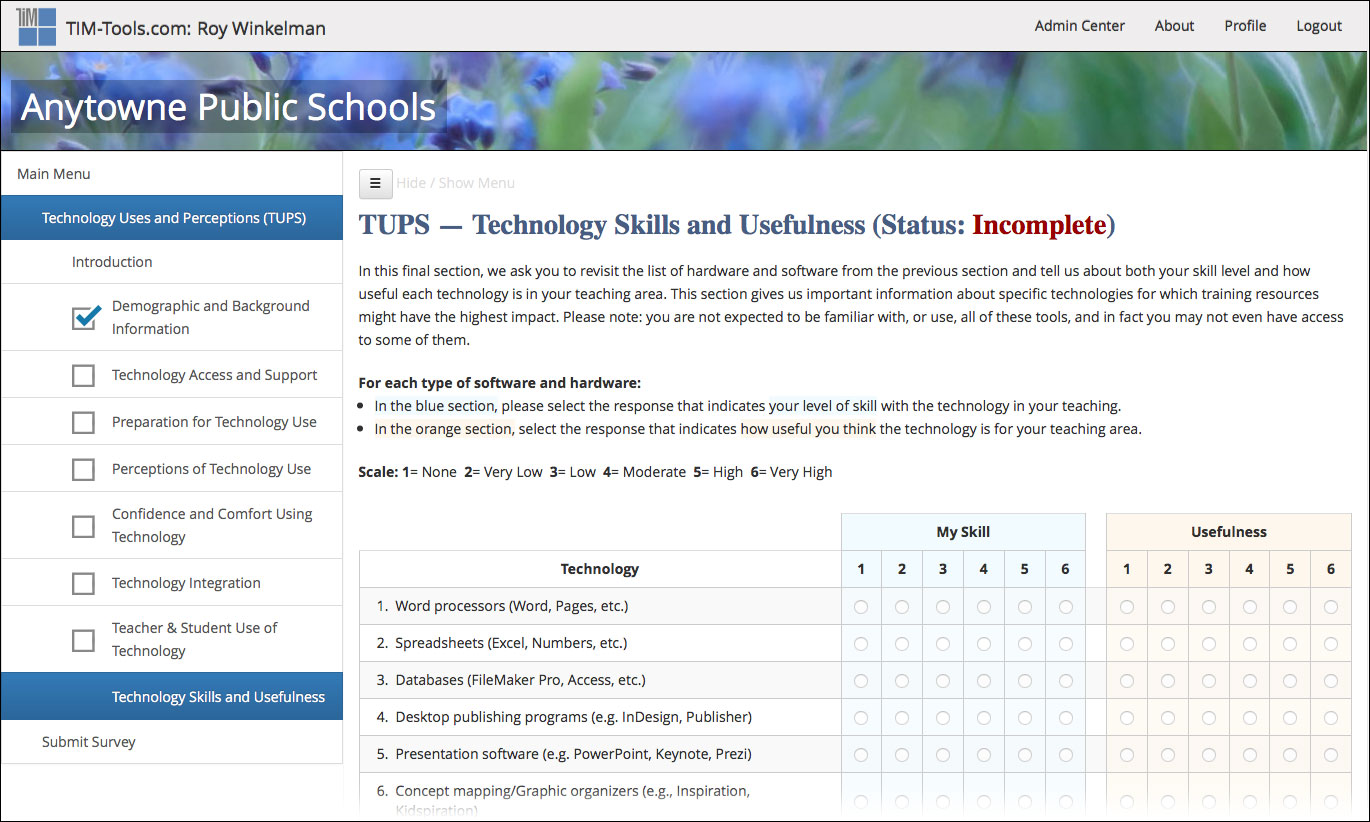
Figure 2. Part of the “Technology Skills and Usefulness” section of the TUPS.
TUPS results are available in several formats to meet a variety of needs:
- If you just want to check on survey completion, the Dashboard gives you the percentage of members who have taken the TUPS at least once an a graphical progress bar.
- District, zone, or school reports can be generated for any date range desired. These reports display results aggregated by school or by district, and include graphs and charts to facilitate interpretation. No member-identifiable data is included. The reports can be output for printing or as a set of webpages. (See Figures 3 and 4.) If the report is output as a set of webpages, the site administrator can set the report to be visible to all members or just to any role or combination of roles.
- Complete raw TUPS data can always be downloaded from TIM Tools. Parameters can be set for the date range, whether to include school or district-wide data, and whether to include member names with the responses. The data download can be used with a special Excel template that will convert it to easy-to-read charts and graphs. (See Figure 5.) The raw data can also be loaded into standard statistical packages such as SAS or SPSS for researchers who are familiar with their use.
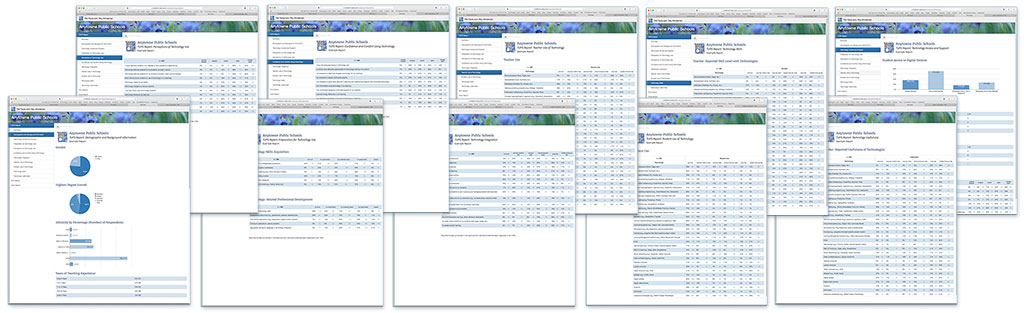
Figure 3. A district summary report output as a series of webpages.
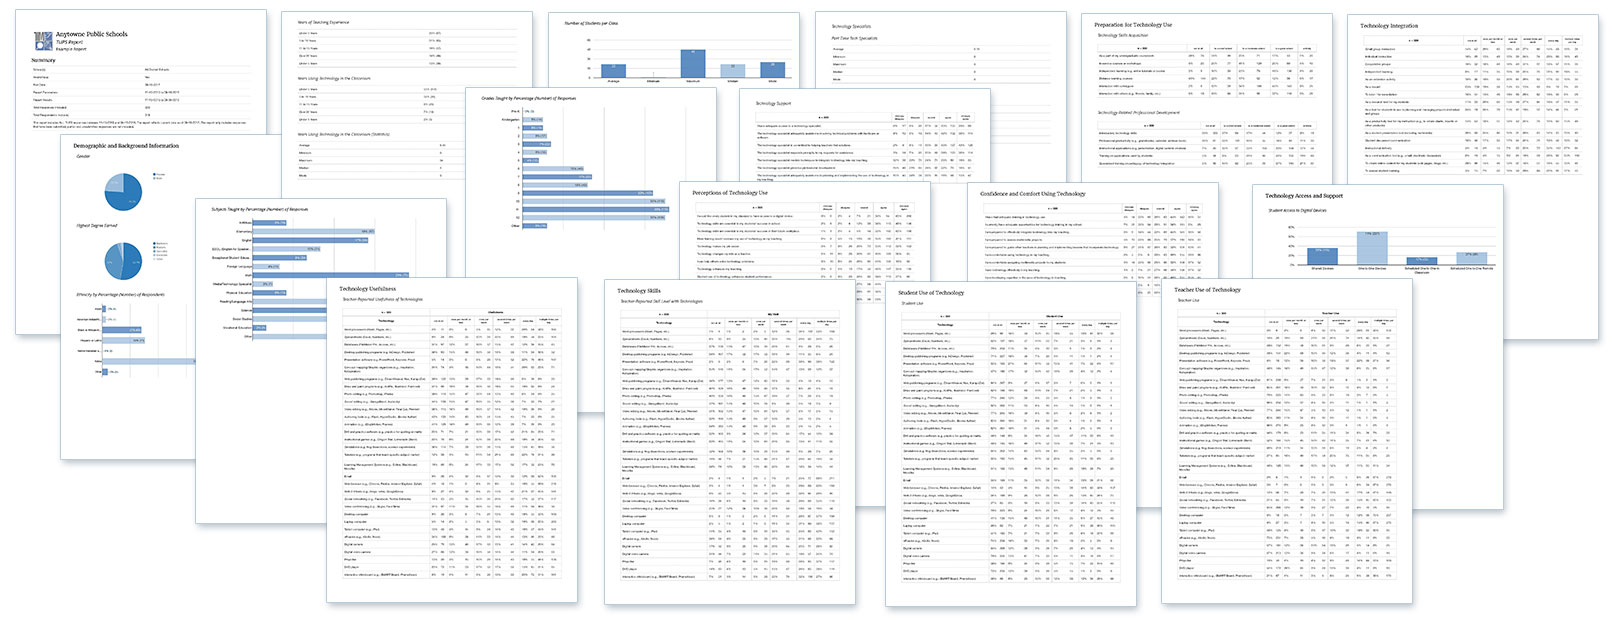
Figure 4. A district summary report output for printing. Reports formatted for print can also be saved as a PDF.
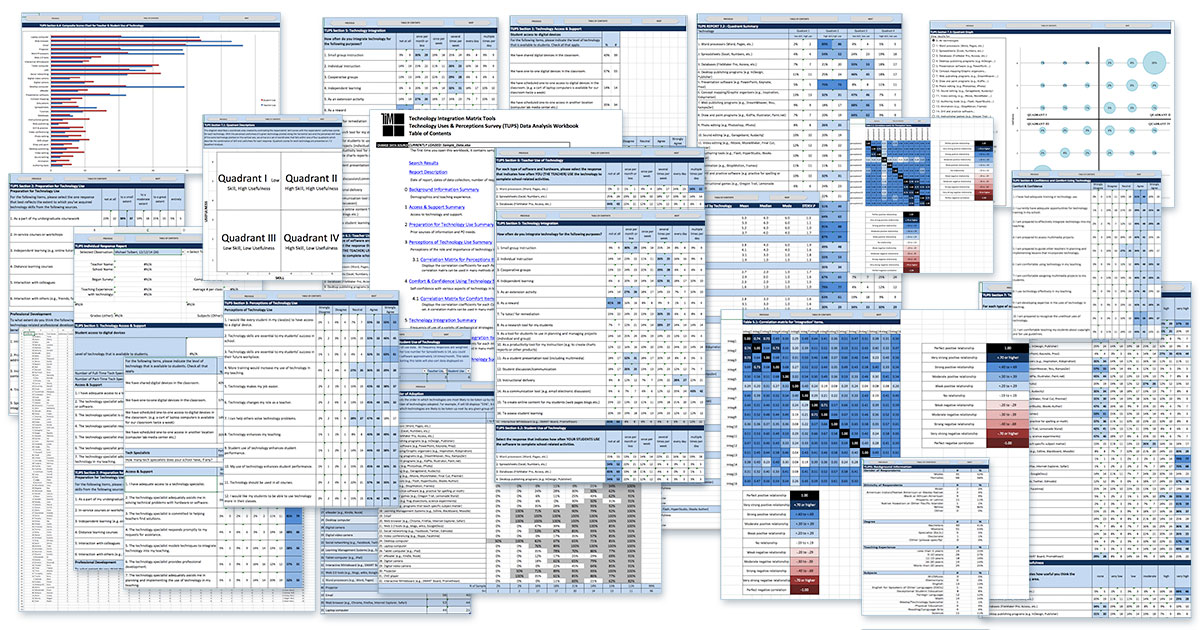
Figure 5. Collage of worksheets from one TUPS report. The report is automatically generated when the raw data download is connected to the supplied TUPS Excel template. The template is a powerful tool in district decision-making due to the ease in which these summary charts and tables connect with the underlying data. A district professional development director, for example, might notice that 6% of the teachers responding indicated that they had very low skills using concept mapping software. Double-clicking the 6% cell will quickly bring up a list of teachers who can be targeted for PD in this area.
As a supplement to the TUPS, the TIM Tools suite also includes a Survey Tool that can be used to create custom surveys for school members or the public. Like other TIM Tools, the Survey Tool maintains the school or district branding in the header graphic.